Free Access
Fig. 1
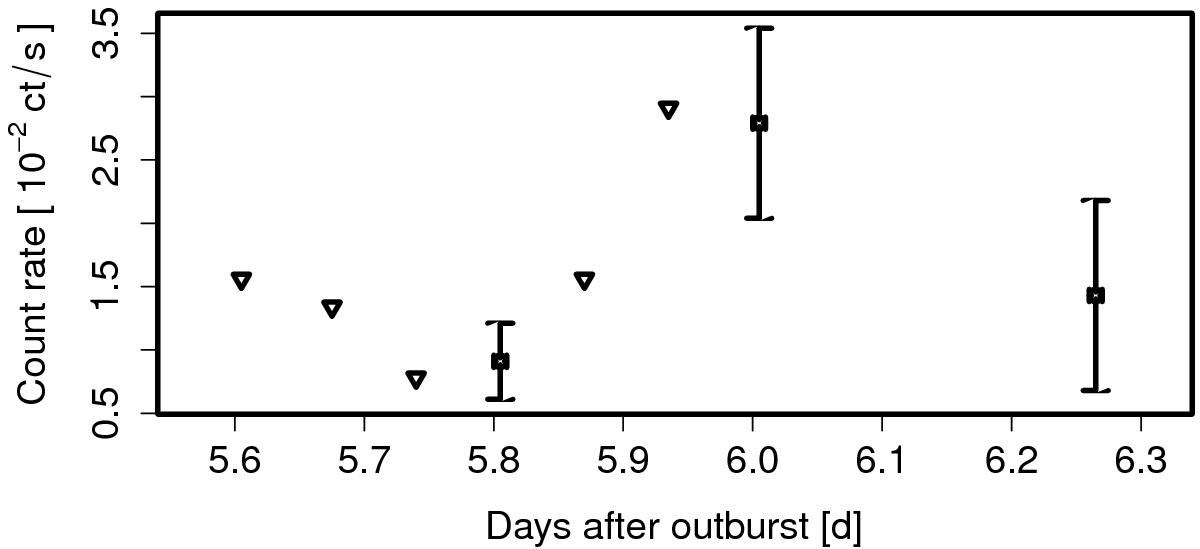
Swift XRT light curve (0.2–10 keV) of nova M31N 2008-12a during day six after outburst. Triangles indicate upper limits. Based on the individual snapshots of observation 00032613048 (see Table 2). This observation likely shows the emergence of the SSS.
Current usage metrics show cumulative count of Article Views (full-text article views including HTML views, PDF and ePub downloads, according to the available data) and Abstracts Views on Vision4Press platform.
Data correspond to usage on the plateform after 2015. The current usage metrics is available 48-96 hours after online publication and is updated daily on week days.
Initial download of the metrics may take a while.