Fig. 9

Download original image
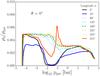
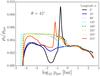
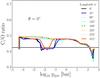
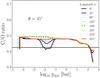
Gas properties as a function of gas pressure for Δφ = + 45° longitude intervals from the cloud formation process. Top row: dust-to-gas ratio ρd/ρgas at latitudes θ = 0° and 45°. Bottom row: C/O ratio at latitudes θ = 0° and 45°. Solid, dotted and dashed lines indicate dayside, day-night terminator and nightside profiles respectively. The horizontal black line indicates solar C/O ratio. Regions of decreasing ρd/ρgas and C/O indicate cloud particle evaporation.
Current usage metrics show cumulative count of Article Views (full-text article views including HTML views, PDF and ePub downloads, according to the available data) and Abstracts Views on Vision4Press platform.
Data correspond to usage on the plateform after 2015. The current usage metrics is available 48-96 hours after online publication and is updated daily on week days.
Initial download of the metrics may take a while.