Fig. 2
Download original image
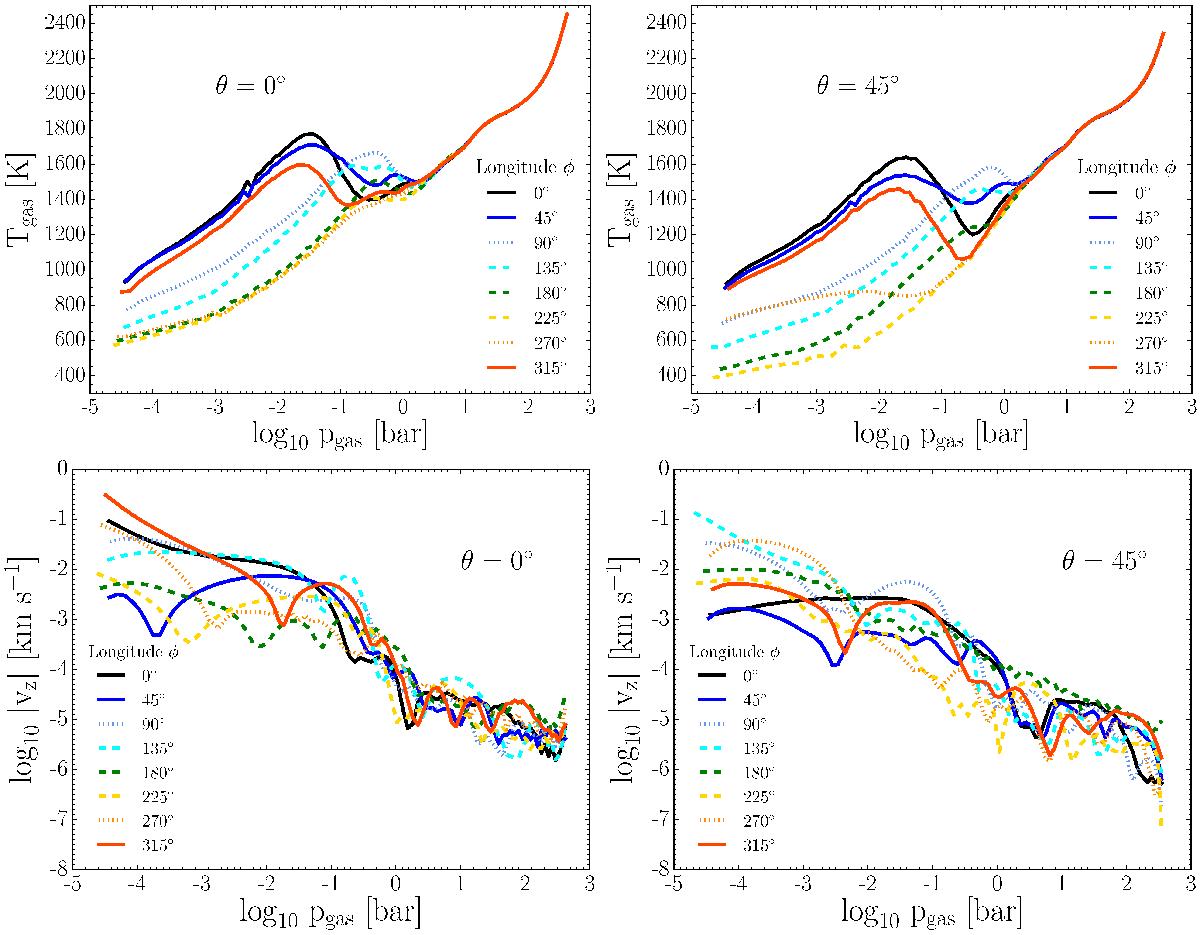
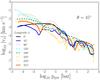
1D trajectory results from the 3D RHD HD 189733b atmosphere simulation used as input for the cloud formation model. Top row: (Tgas, pgas) profiles in steps of longitude Δφ = + 45° at equatorial, θ = 0° and latitude, θ = 45° profiles. Bottom row: smoothed vertical gas velocities vz [km s-1] in steps of longitude Δφ = + 45° at equatorial, θ = 0° and latitude, θ = 45° profiles. Both latitudes show a temperature inversion on the dayside. The sub-stellar point is at φ = 0°, θ = 0°. Solid, dotted and dashed lines indicate dayside, day-night terminator and nightside profiles respectively.
Current usage metrics show cumulative count of Article Views (full-text article views including HTML views, PDF and ePub downloads, according to the available data) and Abstracts Views on Vision4Press platform.
Data correspond to usage on the plateform after 2015. The current usage metrics is available 48-96 hours after online publication and is updated daily on week days.
Initial download of the metrics may take a while.