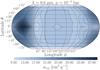
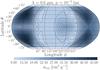
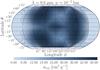
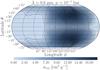
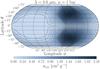
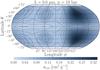
Fig. 14

Download original image
Dust κext [cm2 g-1] opacity for 0.6 μm interpolated across the globe of HD 189733b assuming latitudinal (north-south) symmetry. Top row: 10-4 bar, 10-3 bar. Middle row: 10-2 bar, 10-1 bar. Bottom row: 1 bar, 10 bar, respectively. We take 0.6 μm as representative of the optical wavelength extinction due to cloud. The sub-stellar point is at φ = 0°, θ = 0°. The maximum extinction efficiency shifts from the dayside of the planet to the nightside with increasing depth. Deep in the atmosphere the most opaque region remains at ~225°...315°longitudes. Note: the colour scale for each plot is different.
Current usage metrics show cumulative count of Article Views (full-text article views including HTML views, PDF and ePub downloads, according to the available data) and Abstracts Views on Vision4Press platform.
Data correspond to usage on the plateform after 2015. The current usage metrics is available 48-96 hours after online publication and is updated daily on week days.
Initial download of the metrics may take a while.