Fig. 1
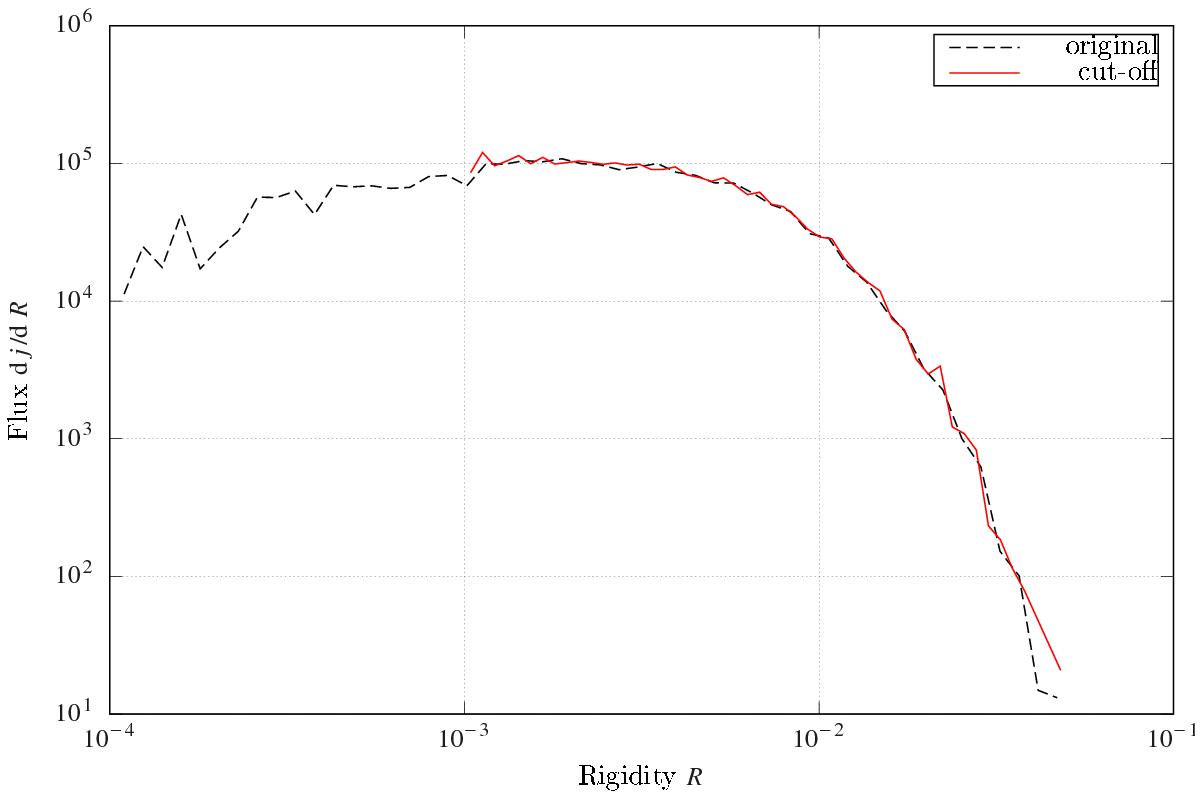
Rigidity injection profile following a Maxwell distribution according to (22)with β = (Rmax − Rmin)/2 and Roffs = Rmin, with Rmin = 10-4 and Rmax = 10-2.1. The red line corresponds to 104 particles used in a simulation, obtained from the original Maxwell distribution shown by the black dotted line with a cutoff value of Rcutoff = 10-3.
Current usage metrics show cumulative count of Article Views (full-text article views including HTML views, PDF and ePub downloads, according to the available data) and Abstracts Views on Vision4Press platform.
Data correspond to usage on the plateform after 2015. The current usage metrics is available 48-96 hours after online publication and is updated daily on week days.
Initial download of the metrics may take a while.