Fig. 4
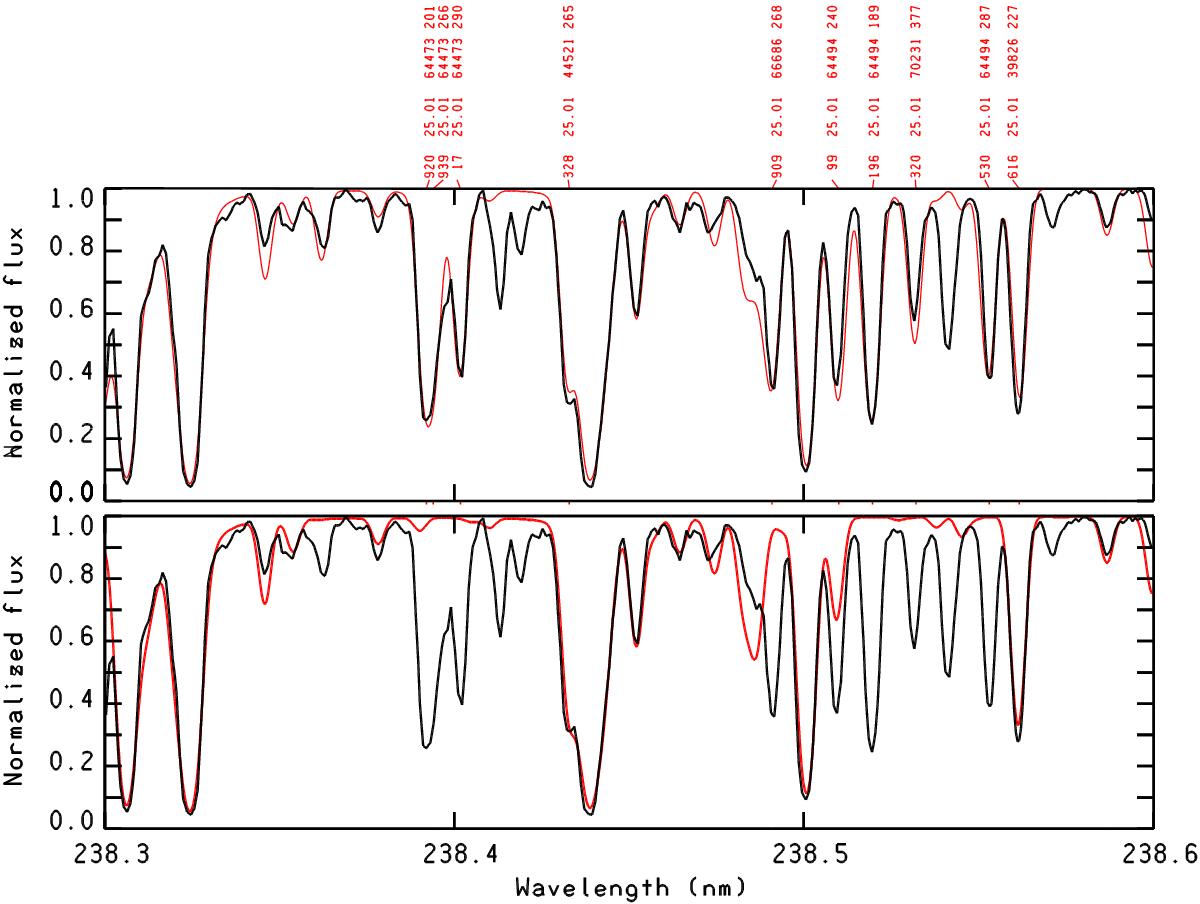
Upper panel: comparison of the STIS spectrum of HD 175640 (black line) with a synthetic spectrum (red line) computed with a line list including the new Mn ii lines; lower panel: the same, but the synthetic spectrum is computed with a line list not including the lines given in Table A.1 (available at the CDS). Only the Mn ii lines are indicated with red labels in the plot. The meaning of the labels is the same as in Fig. 1.
Current usage metrics show cumulative count of Article Views (full-text article views including HTML views, PDF and ePub downloads, according to the available data) and Abstracts Views on Vision4Press platform.
Data correspond to usage on the plateform after 2015. The current usage metrics is available 48-96 hours after online publication and is updated daily on week days.
Initial download of the metrics may take a while.