Fig. 1
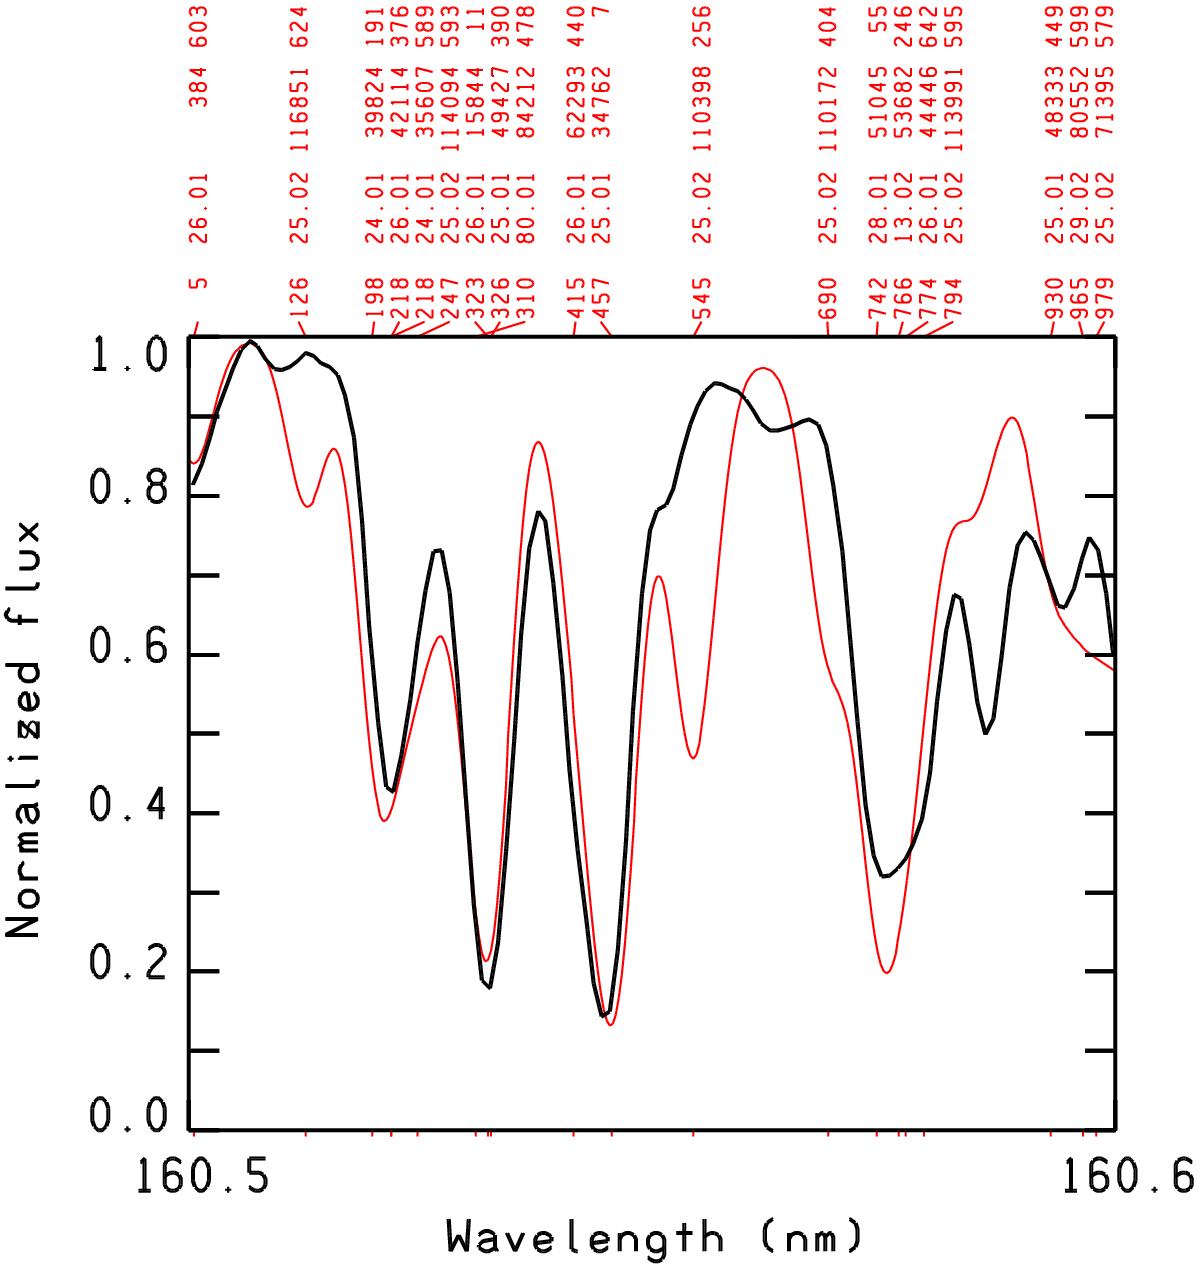
Example of computed spectrum (red line) displaying Mn iii lines not observed in the stellar spectrum (black line). The lines are those at 1605.126 Å, 1605.545 Å, and 1605.690 Å. Their upper level is an even level with energy 179 152.090 cm-1, 172 682.640 cm-1, and 172 451.230 cm-1, respectively. The labels for the lines include the last three digits of the wavelength, the code (atomic number) for the element and ion, the lower energy level in cm-1, and the residual intensity at line center in per mil.
Current usage metrics show cumulative count of Article Views (full-text article views including HTML views, PDF and ePub downloads, according to the available data) and Abstracts Views on Vision4Press platform.
Data correspond to usage on the plateform after 2015. The current usage metrics is available 48-96 hours after online publication and is updated daily on week days.
Initial download of the metrics may take a while.