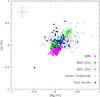
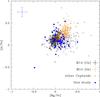
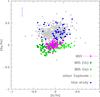
Fig. 10

Correlations between Al–Mg (left and middle panels) and between Na–O (right panel). Cepheid stars (filled circles) are compared with field dwarfs from the thin disk analyzed by Reddy et al. (2003, R03, magenta squares), from the thin (dark green diamonds) and thick (light green diamonds) disks analyzed by Bensby et al. (2005, B05), and from the thin (black crosses) and thick (orange pluses) disks analyzed by Mikolaitis et al. (2014, M14).
Current usage metrics show cumulative count of Article Views (full-text article views including HTML views, PDF and ePub downloads, according to the available data) and Abstracts Views on Vision4Press platform.
Data correspond to usage on the plateform after 2015. The current usage metrics is available 48-96 hours after online publication and is updated daily on week days.
Initial download of the metrics may take a while.