Fig. 3
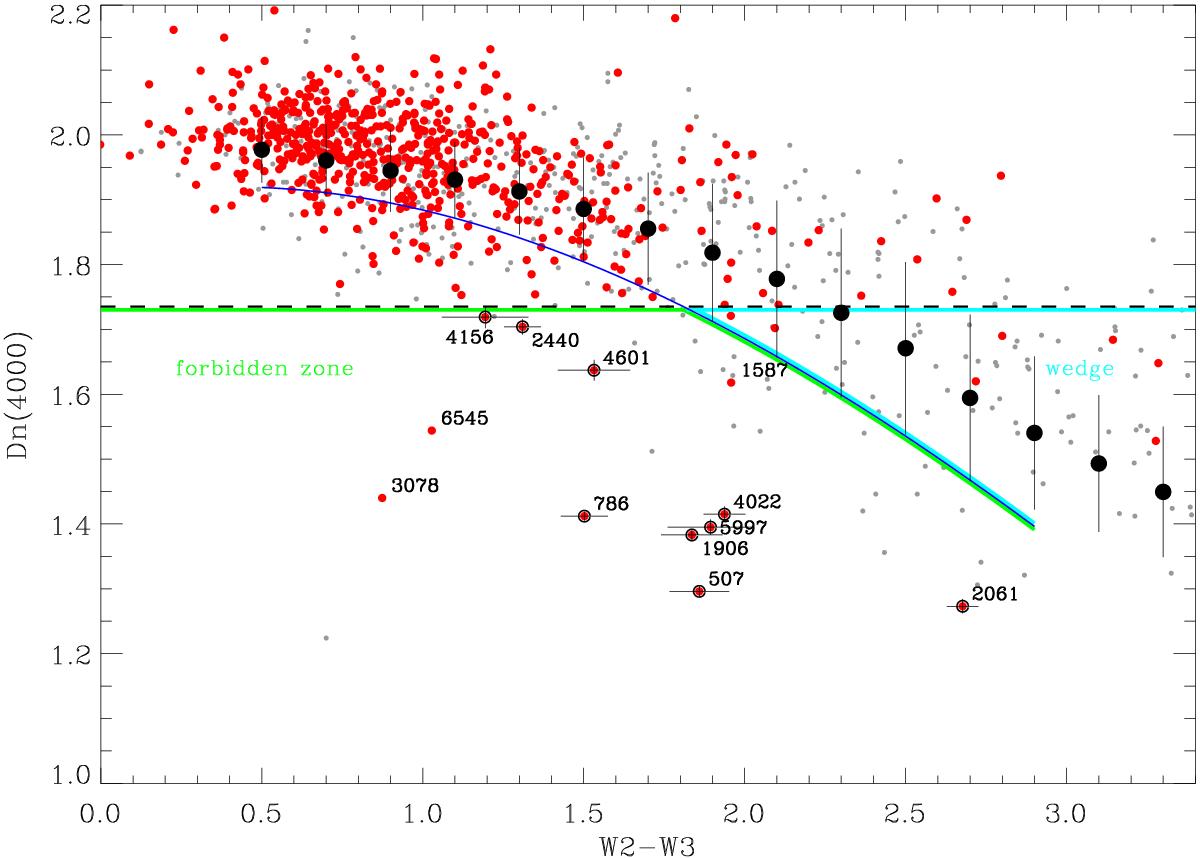
Dn(4000) versus W2−W3 diagram. Black filled circles represent the relationship derived for the MPA-JHU sample that is shown in Fig. 1. The blue line is a polynomial fit to the 1σ limit of this relationship. Gray dots represent the sources in the BH12-A sample with z ≤ 0.1 and S/N> 2 in the W2 and W3 bands. Red dots highlight the objects with rest-frame emission line EW< 5 Å and a FIRST central counterpart. Red dots circled in black are the nine BL Lacs candidates, i.e. those sources with Dn(4000) < 1.735 (shown by the horizontal dashed line) that meet the additional constraint on the Hδ index (see Fig. 4). The boundaries of the forbidden zone and wedge region are highlighted with a green and a cyan line, respectively.
Current usage metrics show cumulative count of Article Views (full-text article views including HTML views, PDF and ePub downloads, according to the available data) and Abstracts Views on Vision4Press platform.
Data correspond to usage on the plateform after 2015. The current usage metrics is available 48-96 hours after online publication and is updated daily on week days.
Initial download of the metrics may take a while.