Fig. 2
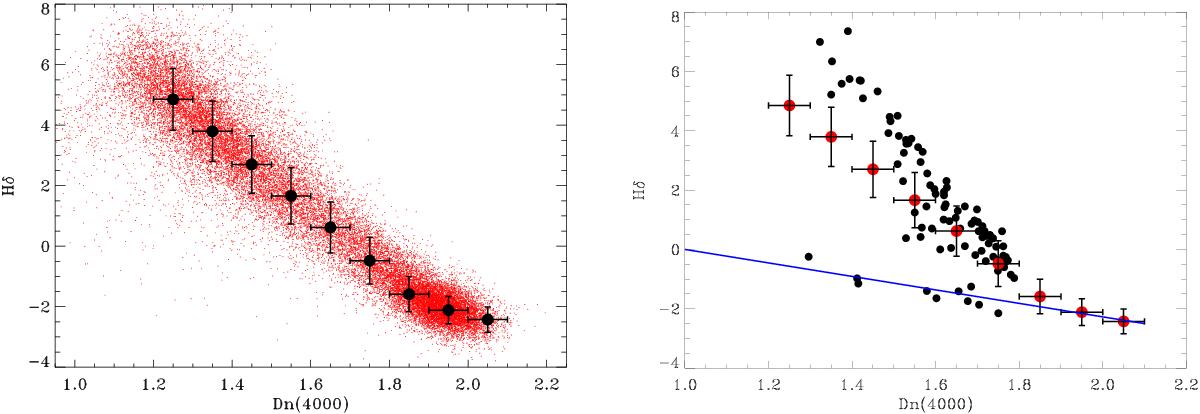
Left: relation between the Dn(4000) and Hδ indices from the SDSS subsample of 21 065 galaxies. For each bin in Dn(4000), the black dots indicate the mean value and dispersion of the best Gaussian fit to the Hδ distribution. Right: Hδ versus Dn(4000) for the outliers of the Dn(4000) versus W2−W3 relation (black dots). The red dots label, for each bin in Dn(4000), the mean value and dispersion of the best Gaussian fit to the Hδ distribution for the overall SDSS galaxies population. The straight blue line is the expected locus of BL Lacs, obtained by varying the ratio between jet and galactic emission (see text for details).
Current usage metrics show cumulative count of Article Views (full-text article views including HTML views, PDF and ePub downloads, according to the available data) and Abstracts Views on Vision4Press platform.
Data correspond to usage on the plateform after 2015. The current usage metrics is available 48-96 hours after online publication and is updated daily on week days.
Initial download of the metrics may take a while.