Fig. 17
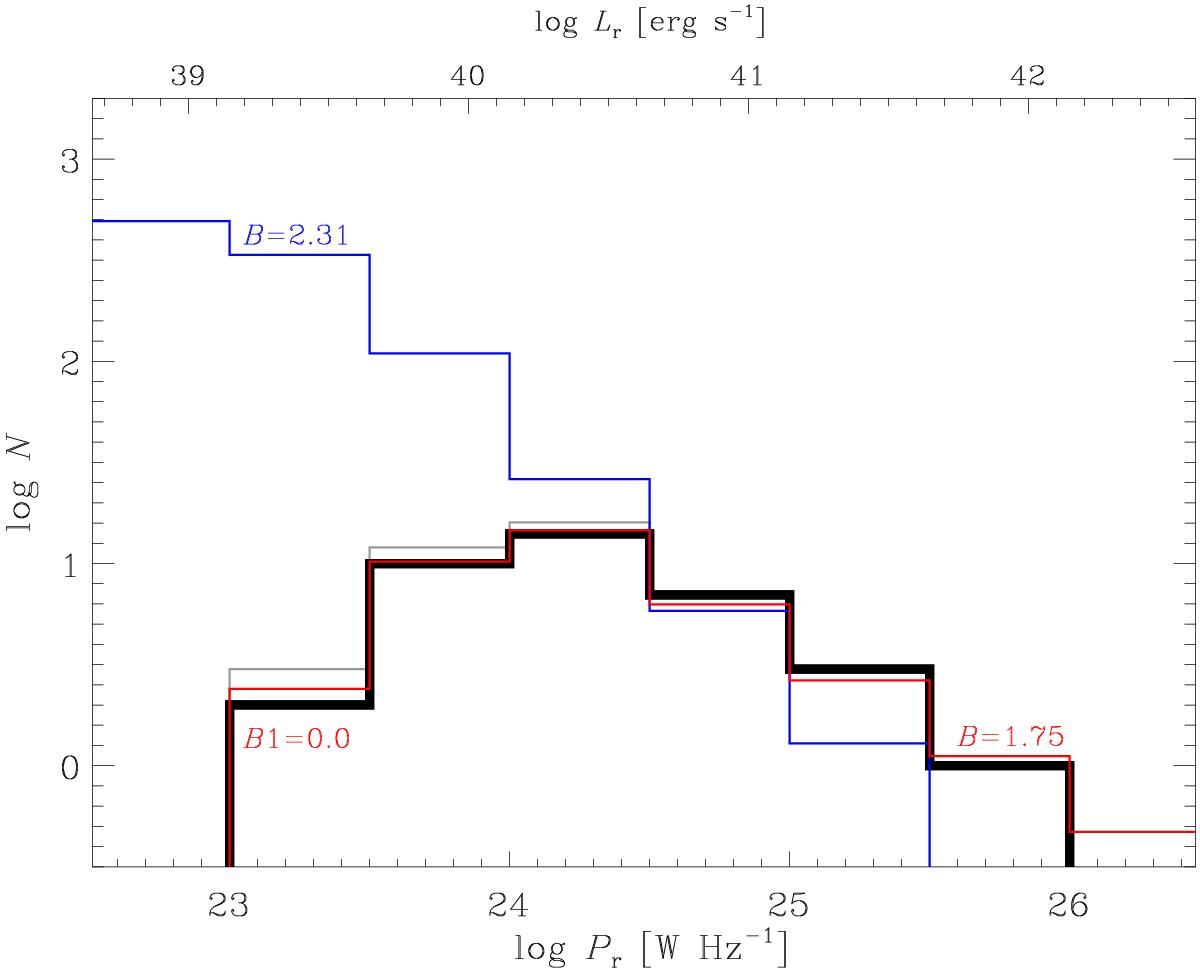
Observed number of BL Lacs (black solid line) versus radio power. The blue histogram represents the predicted number of objects in our volume extrapolating the RLF derived for our sample to low radio luminosities (green line in Fig. 16) and multiplied by the selection function (red line in Fig. 15). The gray histogram shows the effects of the inclusion of the five objects located in the wedge. The red histogram displays the same quantity as for a RLF with B = 1.75 and with a break at log Pr = 24.5 [W Hz-1], below which the RLF slope is B1 = 0.
Current usage metrics show cumulative count of Article Views (full-text article views including HTML views, PDF and ePub downloads, according to the available data) and Abstracts Views on Vision4Press platform.
Data correspond to usage on the plateform after 2015. The current usage metrics is available 48-96 hours after online publication and is updated daily on week days.
Initial download of the metrics may take a while.