Fig. 11
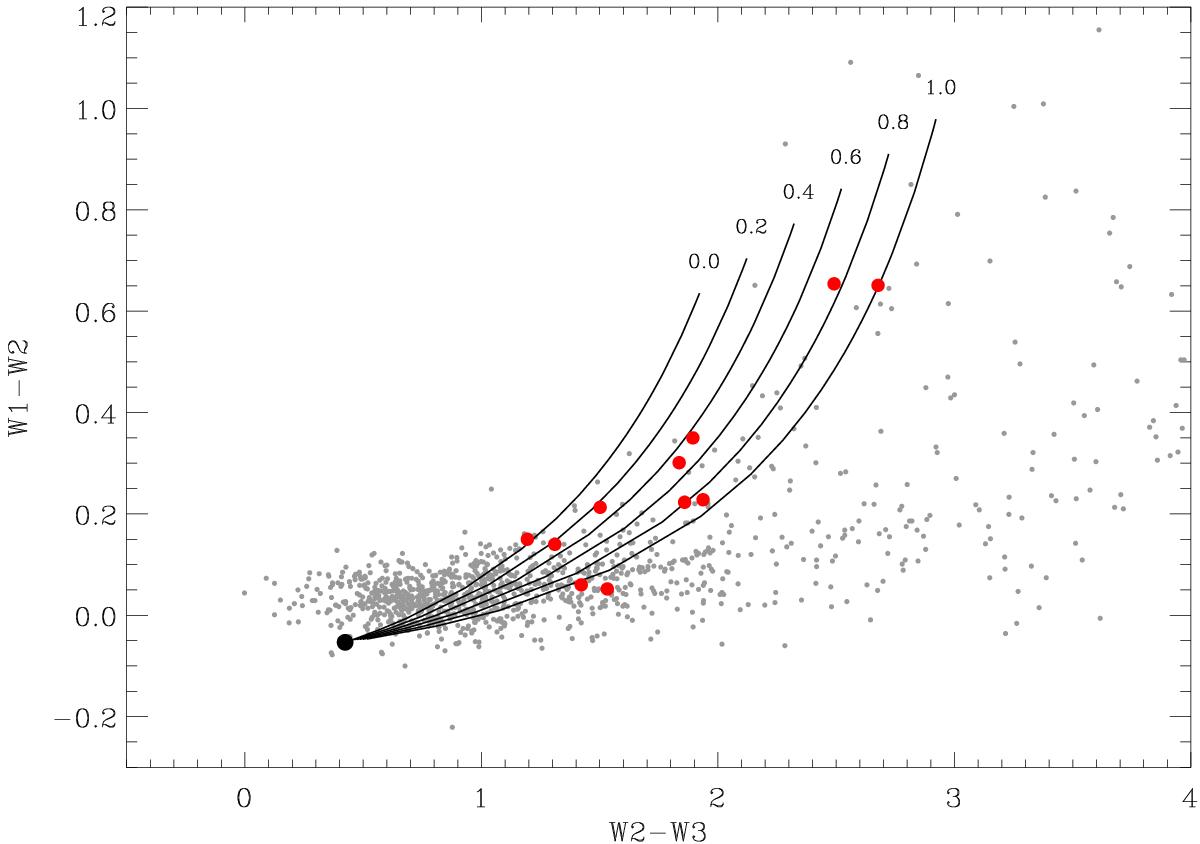
WISE color−color diagram for the BH12 sample with S/N(W3) > 2 and z ≤ 0.1 (gray dots). Red filled circles represent our BL Lac candidates in the same redshift range. The black tracks indicate the sequence followed by objects where a power-law component Fν ~ ν− α of increasing strength is added to the emission of an elliptical galaxy, represented by the black dot. This was derived from the SWIRE template of a 13 Gyr elliptical galaxy at z = 0.1. Different tracks correspond to different values of α in the range 0–1.
Current usage metrics show cumulative count of Article Views (full-text article views including HTML views, PDF and ePub downloads, according to the available data) and Abstracts Views on Vision4Press platform.
Data correspond to usage on the plateform after 2015. The current usage metrics is available 48-96 hours after online publication and is updated daily on week days.
Initial download of the metrics may take a while.