Fig. 1
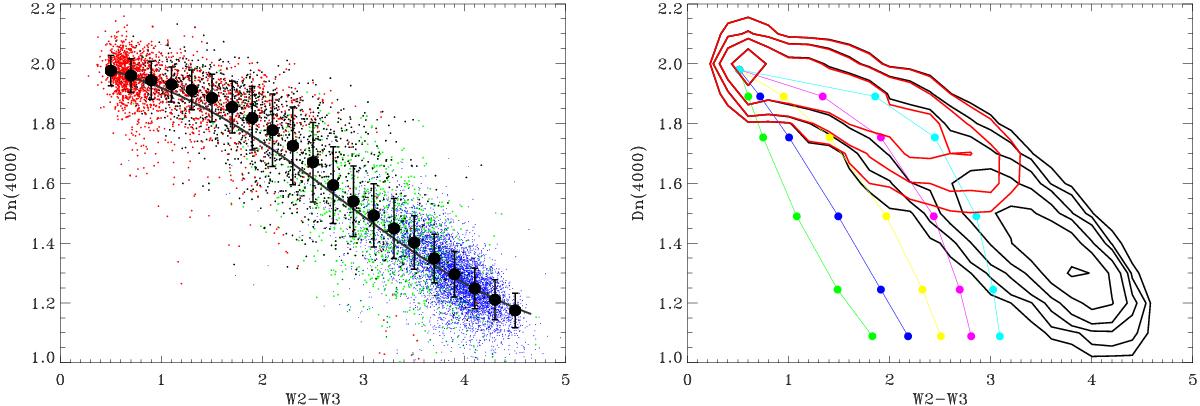
Left: relation between the Dn(4000) index and the W2−W3 color measured from the sample of 21 065 bright nearby galaxies (see text for the selection criteria). For each bin in W2−W3, the large black dots denote the mean value and dispersion of the best Gaussian fit to the Dn(4000) distributions. Each spectroscopic class is highlighted with a color: red for lineless galaxies, black for LINERs, green for Seyferts, and blue for star-forming galaxies. The solid line represents the result of a toy model where a fixed fraction of a blue light component of increasing strength is reprocessed into MIR radiation. Right: simulated Dn(4000) versus W2−W3 tracks obtained by adding a power-law component of increasing strength with a spectral index increasing from 0 (green) to 1 (cyan) with a step of 0.25 to the SED of a quiescent galaxy. Within each track we label the ratios of 0, 0.1, 0.3, 1, 3, and 10 between the jet and galactic components. The black lines trace the iso-density contours of the distribution shown in the left panel; the red lines show the iso-densities contours for the objects with all lines rest frame EW< 5 Å.
Current usage metrics show cumulative count of Article Views (full-text article views including HTML views, PDF and ePub downloads, according to the available data) and Abstracts Views on Vision4Press platform.
Data correspond to usage on the plateform after 2015. The current usage metrics is available 48-96 hours after online publication and is updated daily on week days.
Initial download of the metrics may take a while.