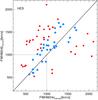
Fig. 9
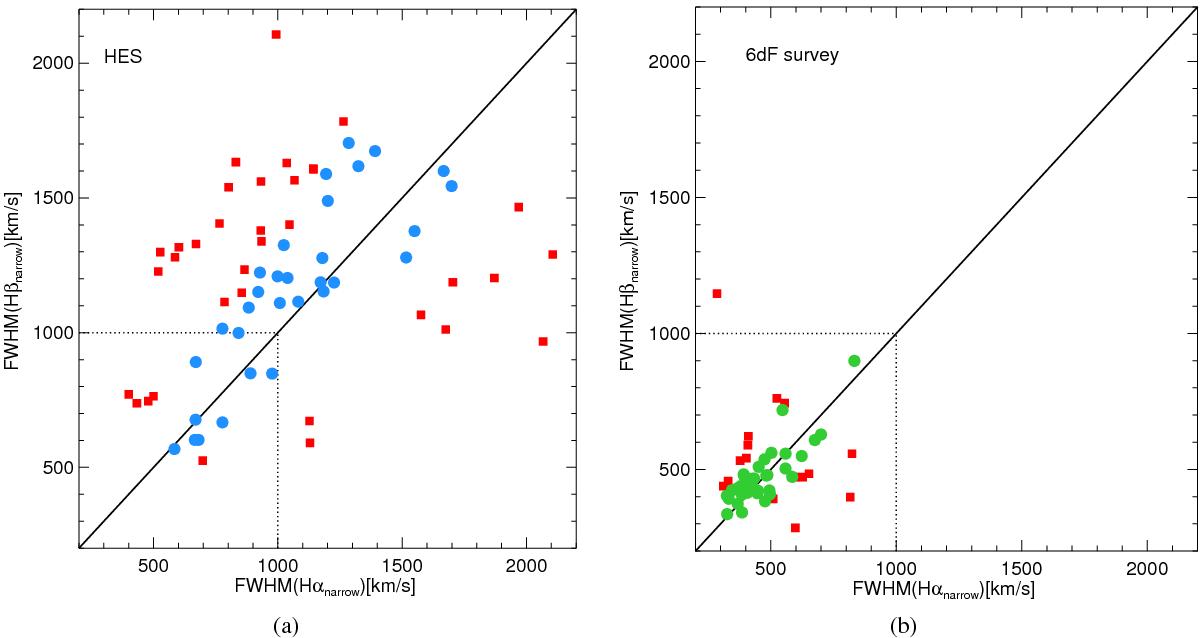
FWHM of narrow components fitted to the hydrogen recombination lines. The black line represents the ideal behavior (FWHM(Hα) = 1.0 FWHM(Hβ)). Squares represent galaxies showing departures from this behavior of more than 25%. Circles represent galaxies that comply with this relation within a 25%. a) Results for the HES. b) Results for the 6df survey.
Current usage metrics show cumulative count of Article Views (full-text article views including HTML views, PDF and ePub downloads, according to the available data) and Abstracts Views on Vision4Press platform.
Data correspond to usage on the plateform after 2015. The current usage metrics is available 48-96 hours after online publication and is updated daily on week days.
Initial download of the metrics may take a while.