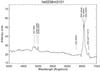
Fig. 4
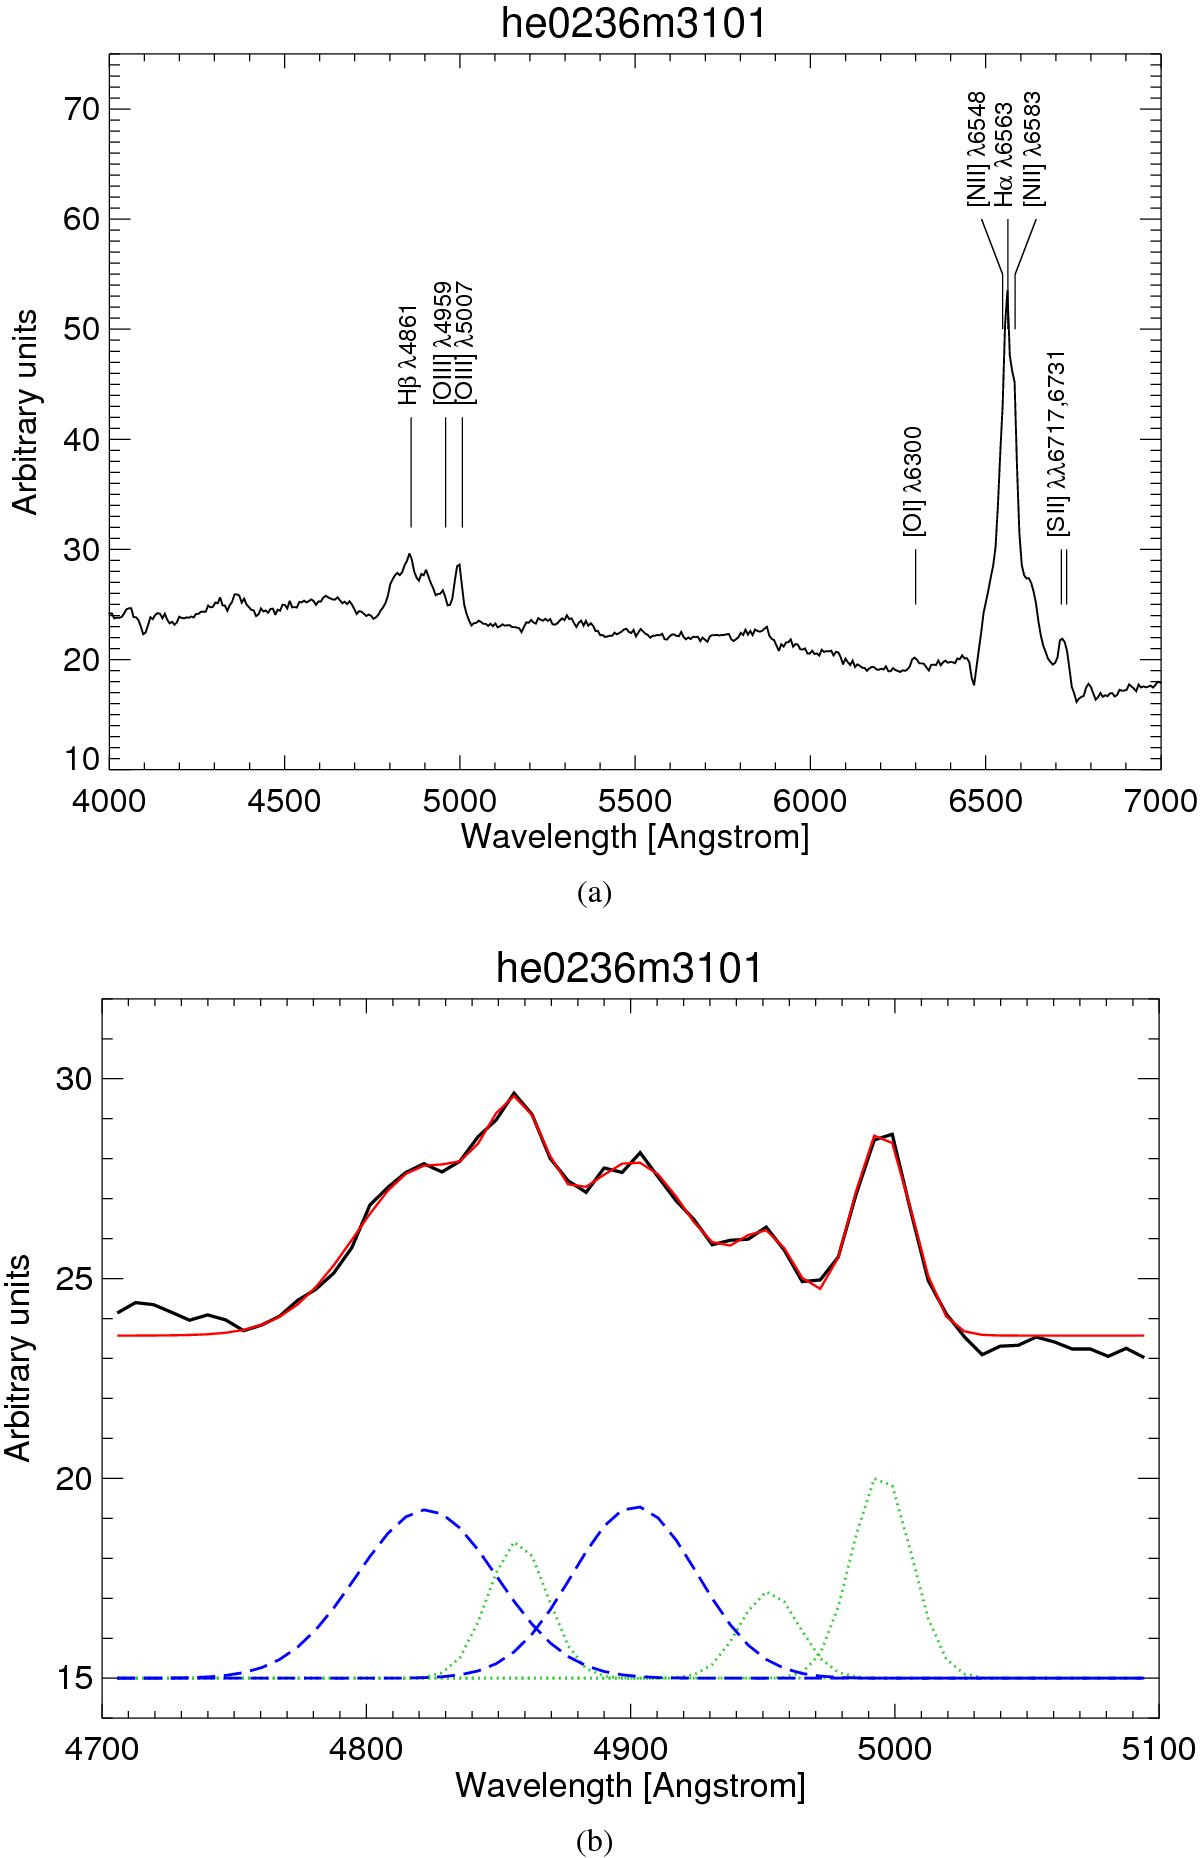
a) HE0236-3101 (ID 27) as observed by the HES. All emission lines of interest are labeled. b) Fitting of Hβλ4861 Å. Note the double Hβ broad components needed to fit the spectrum. The blue dashed lines represent the broad components, the green dotted lines represent the narrow components, and the solid red line represents the final fit.
Current usage metrics show cumulative count of Article Views (full-text article views including HTML views, PDF and ePub downloads, according to the available data) and Abstracts Views on Vision4Press platform.
Data correspond to usage on the plateform after 2015. The current usage metrics is available 48-96 hours after online publication and is updated daily on week days.
Initial download of the metrics may take a while.