Fig. 17
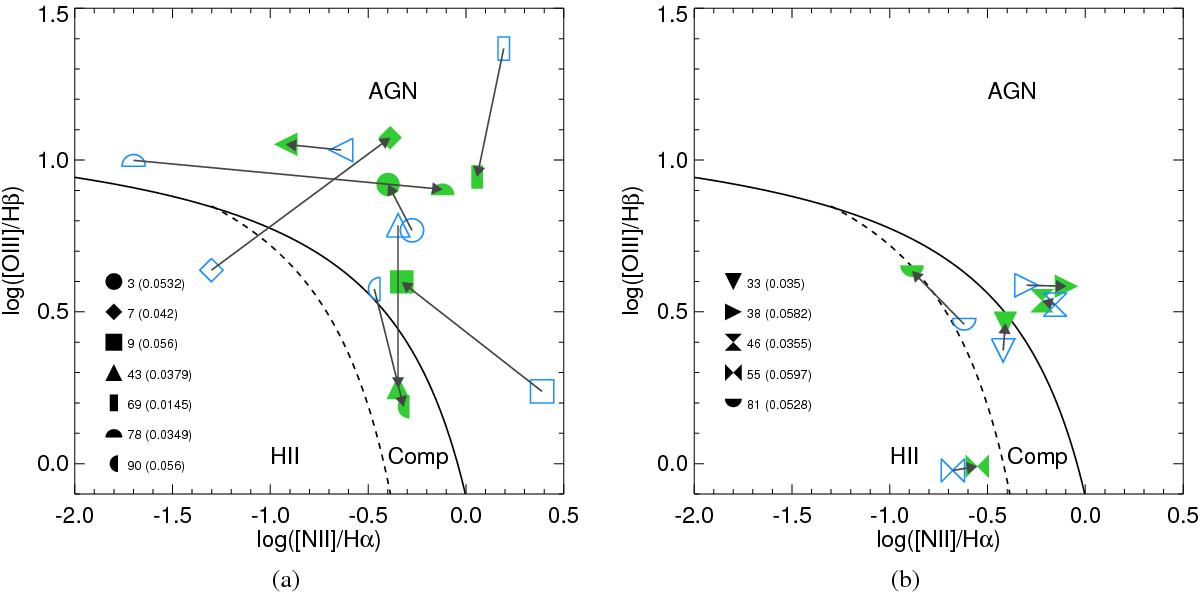
Diagnostic diagram of cross-matching sources, illustrating the aperture effect. Filled green symbols represent the 6dfGS classification, whereas empty blue symbols show the classification as estimated with the HES. Source identifiers are also given. The 6dfGS data were all taken later in time than the HES, changes in classification are also indicated by arrows. For all sources, the redshift and years between observations is given. Sources comply with the quality criteria defined for the width of the narrow hydrogen recombination lines in Sect. 5.1.
Current usage metrics show cumulative count of Article Views (full-text article views including HTML views, PDF and ePub downloads, according to the available data) and Abstracts Views on Vision4Press platform.
Data correspond to usage on the plateform after 2015. The current usage metrics is available 48-96 hours after online publication and is updated daily on week days.
Initial download of the metrics may take a while.