Fig. 13
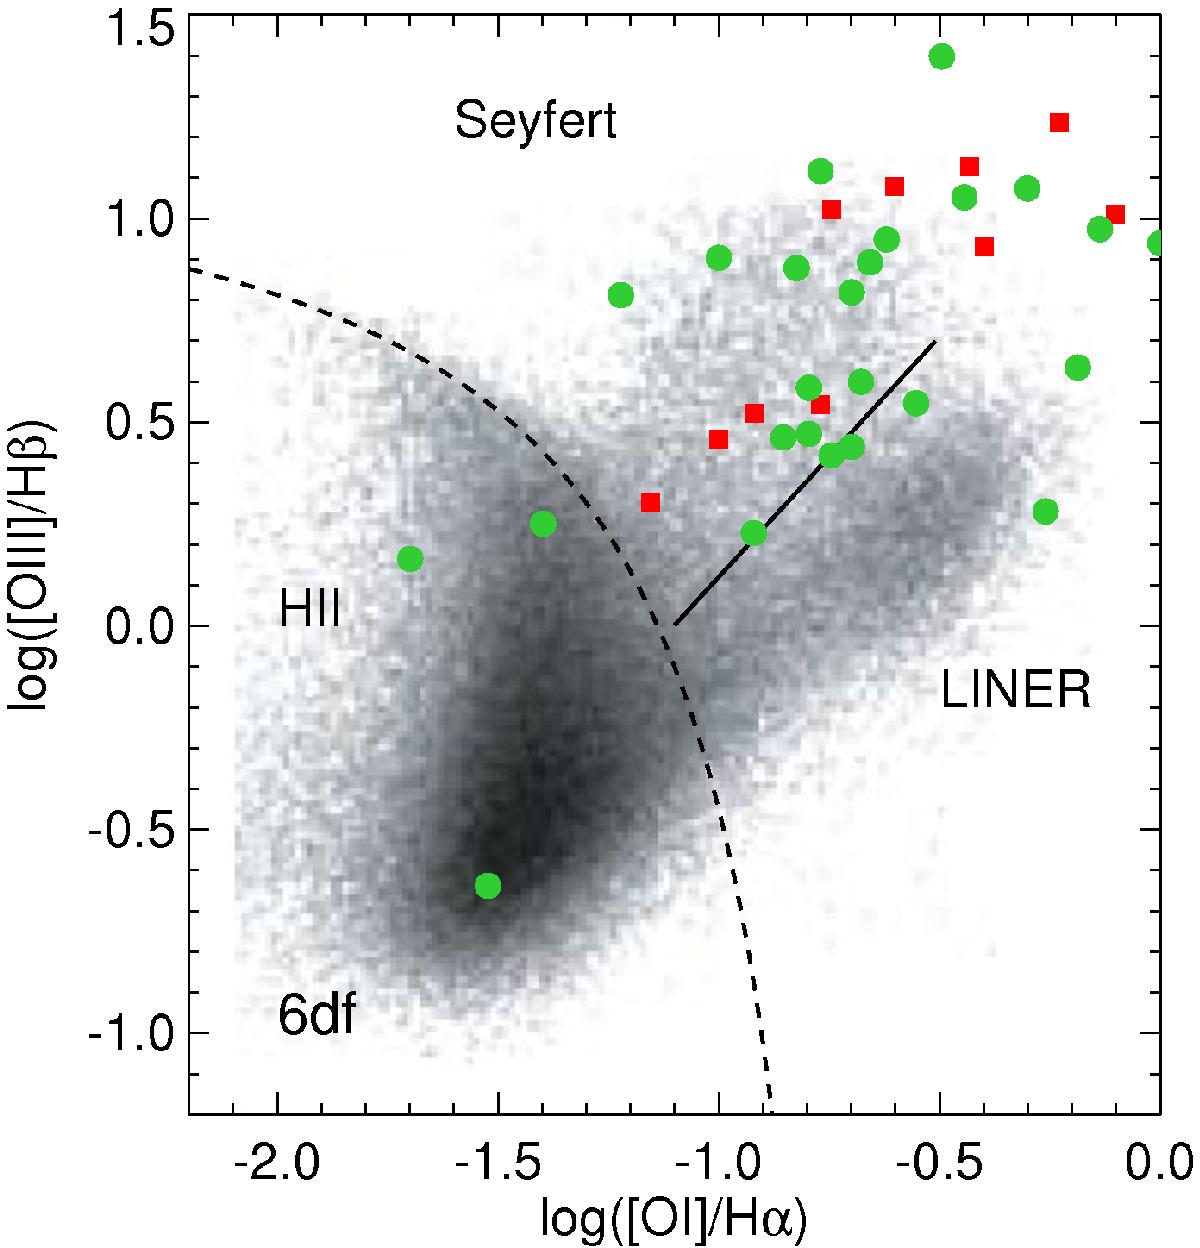
[O i]/Hα versus [O iii]/Hβ diagnostic diagram for the 6dFGS data. The demarcation lines are from Kewley et al. (2006). The solid line represents the division between Seyferts and LINERs. The dark cloud represents SDSS galaxies from a previous study by Kewley et al. (2006). Green circles represent galaxies that follow the narrow lines width criteria (see Sect. 5.1), and red squares represent those that do not.
Current usage metrics show cumulative count of Article Views (full-text article views including HTML views, PDF and ePub downloads, according to the available data) and Abstracts Views on Vision4Press platform.
Data correspond to usage on the plateform after 2015. The current usage metrics is available 48-96 hours after online publication and is updated daily on week days.
Initial download of the metrics may take a while.