Free Access
Fig. 9
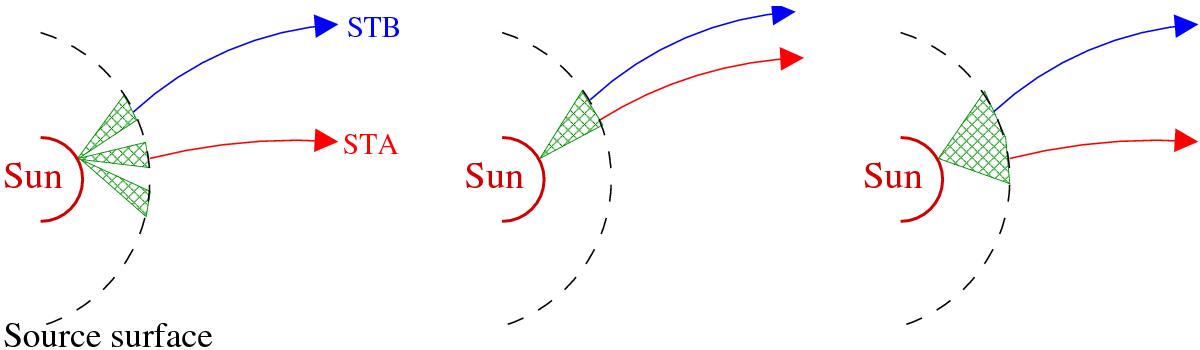
Sketch illustrating the suggested injection scenarios and electron source(s) distribution at the source surface (not drawn to scale). Left: multipoint source; middle: single point-like source; and right: extended source. The green hatched cone(s) shows the beam(s) injected from the parent source.
Current usage metrics show cumulative count of Article Views (full-text article views including HTML views, PDF and ePub downloads, according to the available data) and Abstracts Views on Vision4Press platform.
Data correspond to usage on the plateform after 2015. The current usage metrics is available 48-96 hours after online publication and is updated daily on week days.
Initial download of the metrics may take a while.