Fig. 3
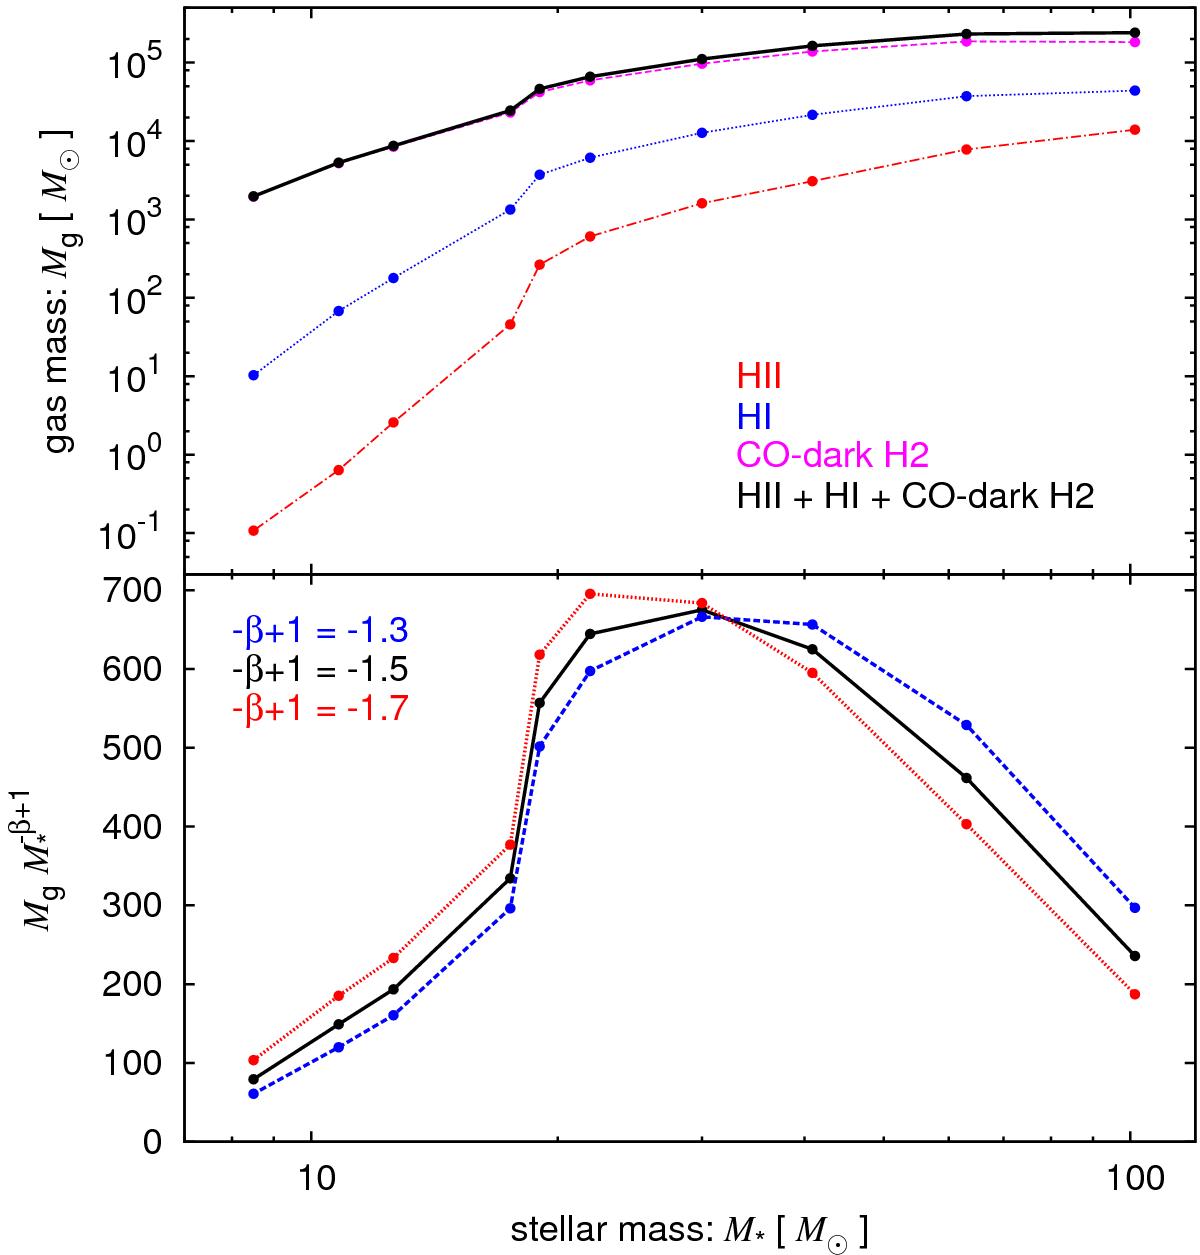
Upper panel: masses in various phases transformed from cold molecular gas around an expanding HII region at the termination time as a function of the mass of a central star. The red dot-dashed line, the blue dotted line, and purple dashed line correspond to ionized hydrogen in the HII region, neutral hydrogen in the photodissociation region, and warm molecular hydrogen gas without CO, respectively. The uppermost black solid line denotes the total mass of these non-star-forming gases. Lower panel: the IMF-weighted mass of non-star-forming gas transformed from molecular gas by a massive star of mass M∗. The area under the curve is proportional to the mass generated by massive stars whose mass function follows dn/d![]() , −β + 1 = −1.3 (blue dashed), −1.5 (black solid), −1.7 (red dotted). The peak of the curve determines the inverse of star formation efficiency ϵSF (see explanation below Eq. (7)).
, −β + 1 = −1.3 (blue dashed), −1.5 (black solid), −1.7 (red dotted). The peak of the curve determines the inverse of star formation efficiency ϵSF (see explanation below Eq. (7)).
Current usage metrics show cumulative count of Article Views (full-text article views including HTML views, PDF and ePub downloads, according to the available data) and Abstracts Views on Vision4Press platform.
Data correspond to usage on the plateform after 2015. The current usage metrics is available 48-96 hours after online publication and is updated daily on week days.
Initial download of the metrics may take a while.