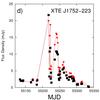
Fig. 3
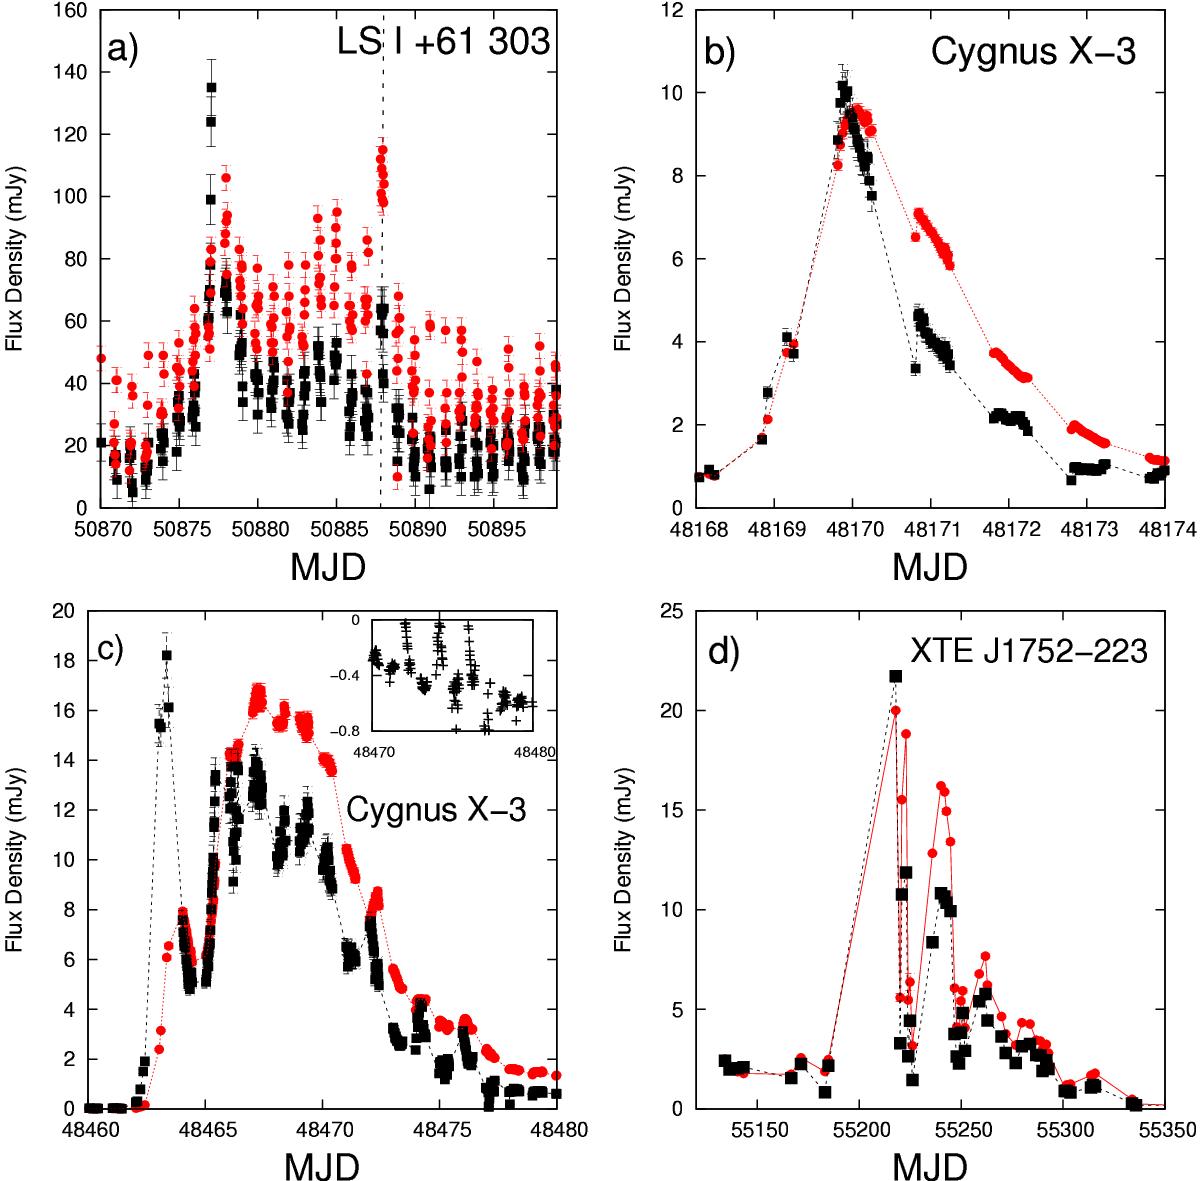
Structured radio outbursts in LS I +61°303, Cygnus X-3, and XTE 1752-223: an outburst with flat/inverted spectrum is followed by optically thin events. a) LS I +61°303 (GBI data, black squares: 8.3 GHz, red circles: 2.2 GHz; see also Fig. 3 in Massi 2015). The black dashed line at MJD 50 888 indicates the optically thin flare of LS I +61°303 observed at 1.25 mm wavelength by Paredes et al. (2000), b)–c) Cygnus X-3 (GBI data, black squares: 8.3 GHz, red circles: 2.2 GHz). Here, quasi-periodic oscillations of the spectral index are shown in the inset, d) XTE J1752-223 (ATCA data, black squares: 9 GHz, red circles: 5.5 GHz, whereas errors are smaller than the symbols size).
Current usage metrics show cumulative count of Article Views (full-text article views including HTML views, PDF and ePub downloads, according to the available data) and Abstracts Views on Vision4Press platform.
Data correspond to usage on the plateform after 2015. The current usage metrics is available 48-96 hours after online publication and is updated daily on week days.
Initial download of the metrics may take a while.