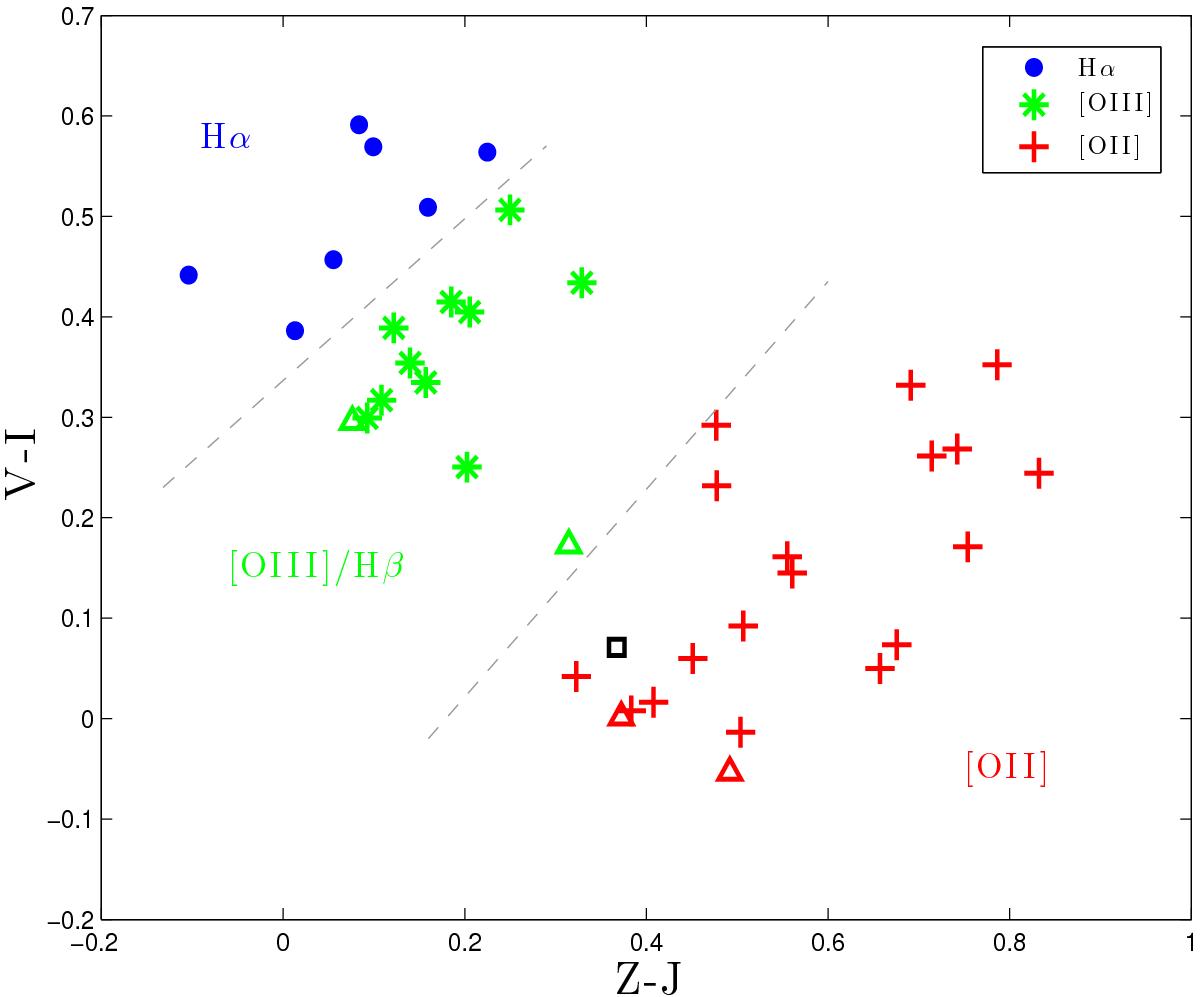
Fig. 6

Z−J versus V−I colour distribution for our basic sample, with V = F606W, I = F814W, z = F850LP, and J = F125W, as taken from G13. Solid dots are secure redshifts, open triangles are primary redshift solutions, the black square labels ELG30 for which there is no preferred redshift. As in Bayliss et al. (2011), we see a clear separation of redshifts into separate colour groupings, making this diagram useful as a redshift diagnostic for emission-line-selected samples.
Current usage metrics show cumulative count of Article Views (full-text article views including HTML views, PDF and ePub downloads, according to the available data) and Abstracts Views on Vision4Press platform.
Data correspond to usage on the plateform after 2015. The current usage metrics is available 48-96 hours after online publication and is updated daily on week days.
Initial download of the metrics may take a while.


