Fig. 2
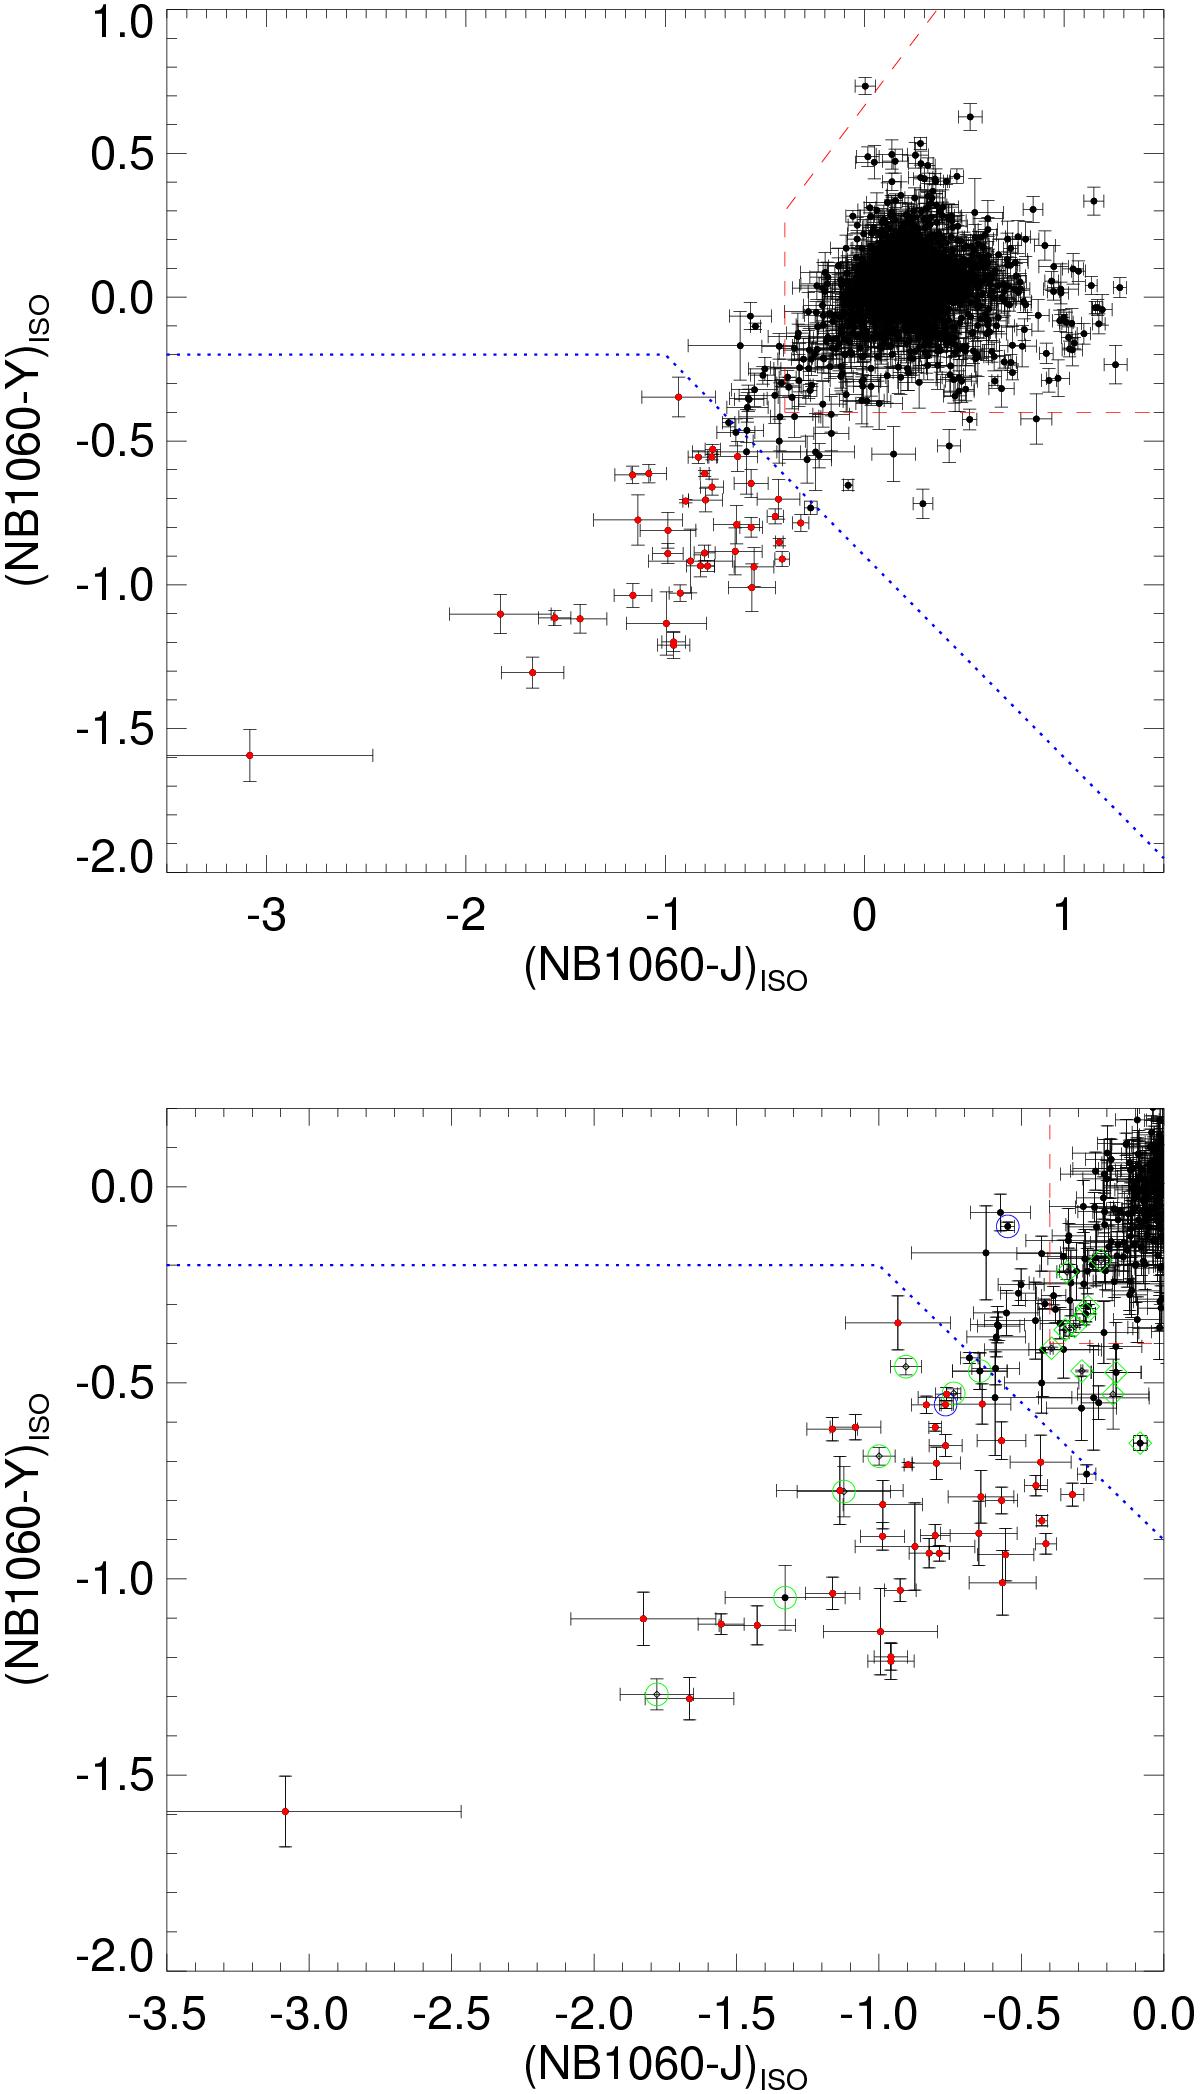
Colour–colour diagram for objects detected in the NB1060 image and brighter than NB1060(AUTO) = 24.8. The top panel represents the colour distribution of continuum and emission-line galaxies. The expected region occupied by continuum emitters is enclosed by a red dashed line, whereas the region we use to select candidate line emitters lies below the blue dotted line. Red dots represent objects from the basic sample, i.e. objects that meet the selection criteria. The lower panel additionally shows objects in green circles and green diamonds that have emission-lines but do not enter our basic sample because they either are masked or lie outside a conservatively defined selection area (therefore above the blue dotted line).
Current usage metrics show cumulative count of Article Views (full-text article views including HTML views, PDF and ePub downloads, according to the available data) and Abstracts Views on Vision4Press platform.
Data correspond to usage on the plateform after 2015. The current usage metrics is available 48-96 hours after online publication and is updated daily on week days.
Initial download of the metrics may take a while.