Fig. 16
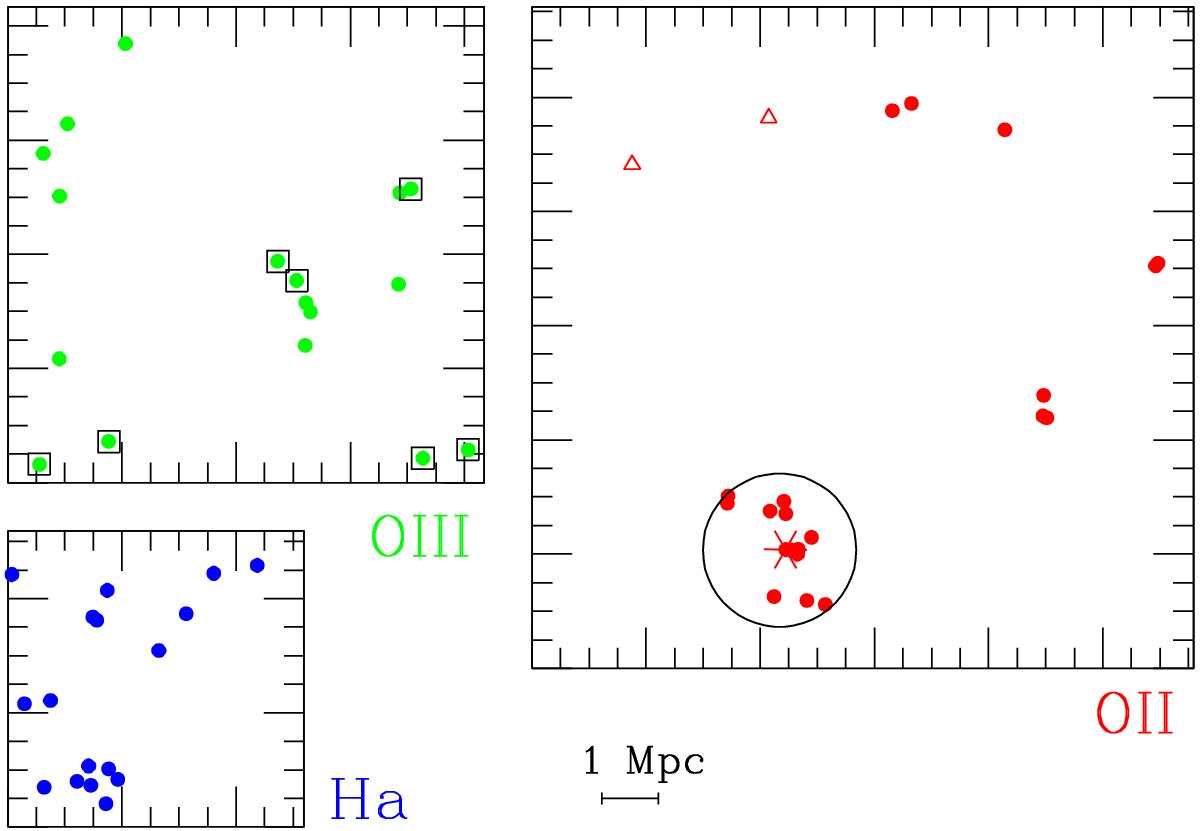
Objects detected in the three redshift slices shown separately and scaled to the same co-moving scale. The colour coding is as in previous figures: dots denote certain redshifts from the extended sample, and open triangles indicate primary redshifts for the two uncertain cases. Open black squares indicate objects with known spectroscopic redshifts in the [Oiii] slice. The red star in the [Oii] slice marks the galaxy with the highest M⋆, and the large black circle the cluster centered on it at z = 1.85.
Current usage metrics show cumulative count of Article Views (full-text article views including HTML views, PDF and ePub downloads, according to the available data) and Abstracts Views on Vision4Press platform.
Data correspond to usage on the plateform after 2015. The current usage metrics is available 48-96 hours after online publication and is updated daily on week days.
Initial download of the metrics may take a while.