Fig. 15
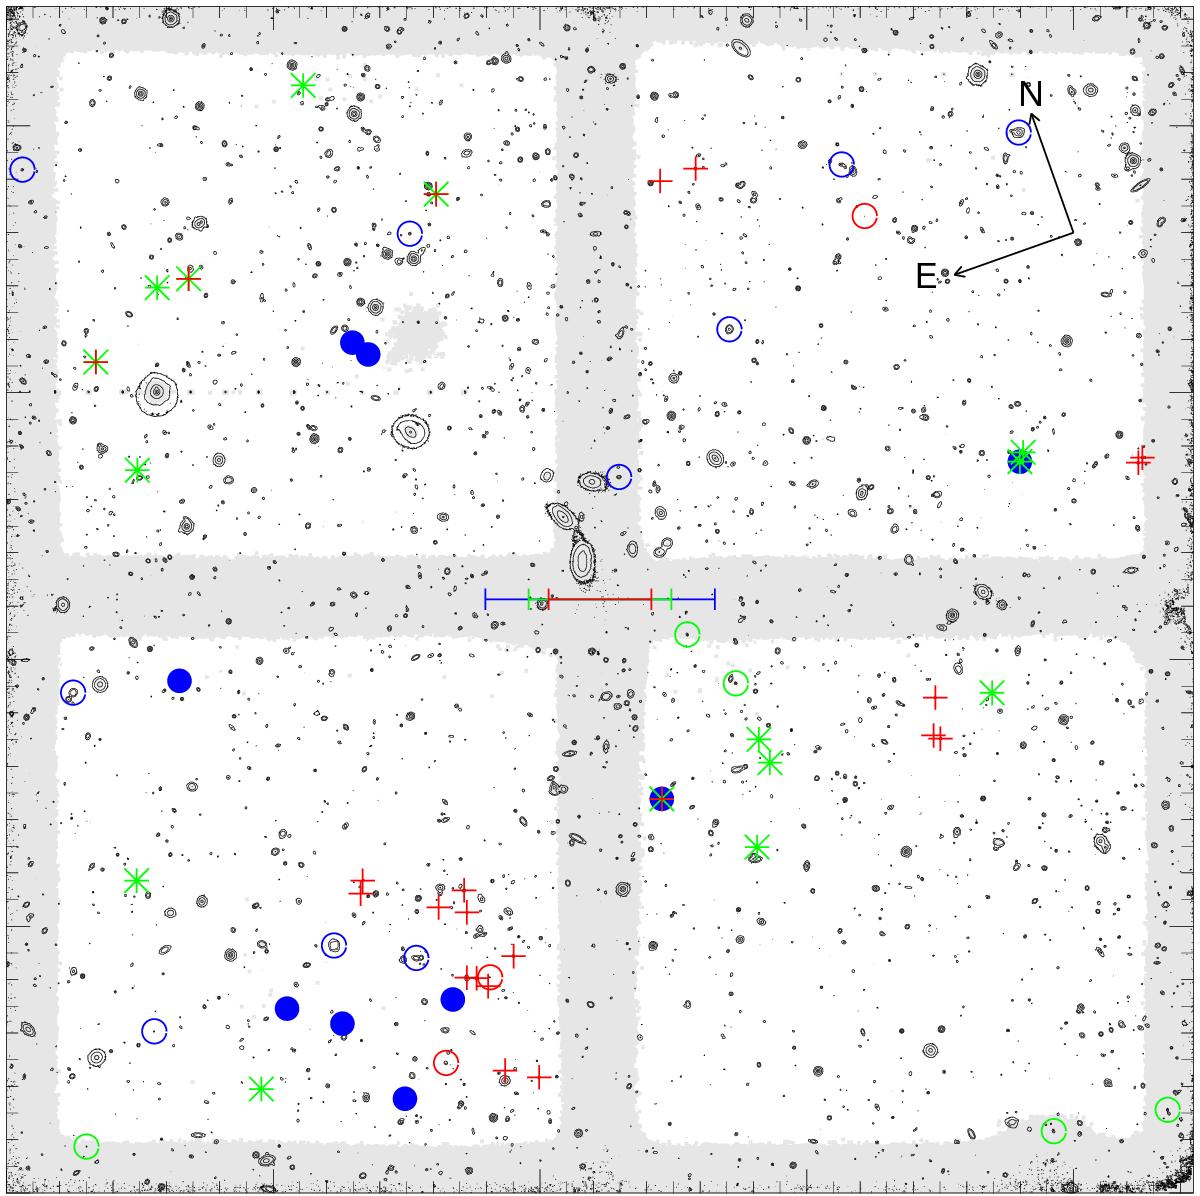
Objects identified in the three redshift slices overplotted on the narrow-band image (black contours). Blue dots are Hα emitters, green asterisks are [Oiii]/Hβ, and red crosses represent the [Oii] emitters. Lower S/N areas of the image that were excluded from the basic sample are shaded in grey. Multiple symbols that are over-plotted represent galaxies with multiple redshift solutions. Open circles represent galaxies from the “extended sample”. Bars of length 1 comoving Mpc at the given redshift is over-plotted in the centre of the image with same colour-coding as for the objects.
Current usage metrics show cumulative count of Article Views (full-text article views including HTML views, PDF and ePub downloads, according to the available data) and Abstracts Views on Vision4Press platform.
Data correspond to usage on the plateform after 2015. The current usage metrics is available 48-96 hours after online publication and is updated daily on week days.
Initial download of the metrics may take a while.