Fig. 14
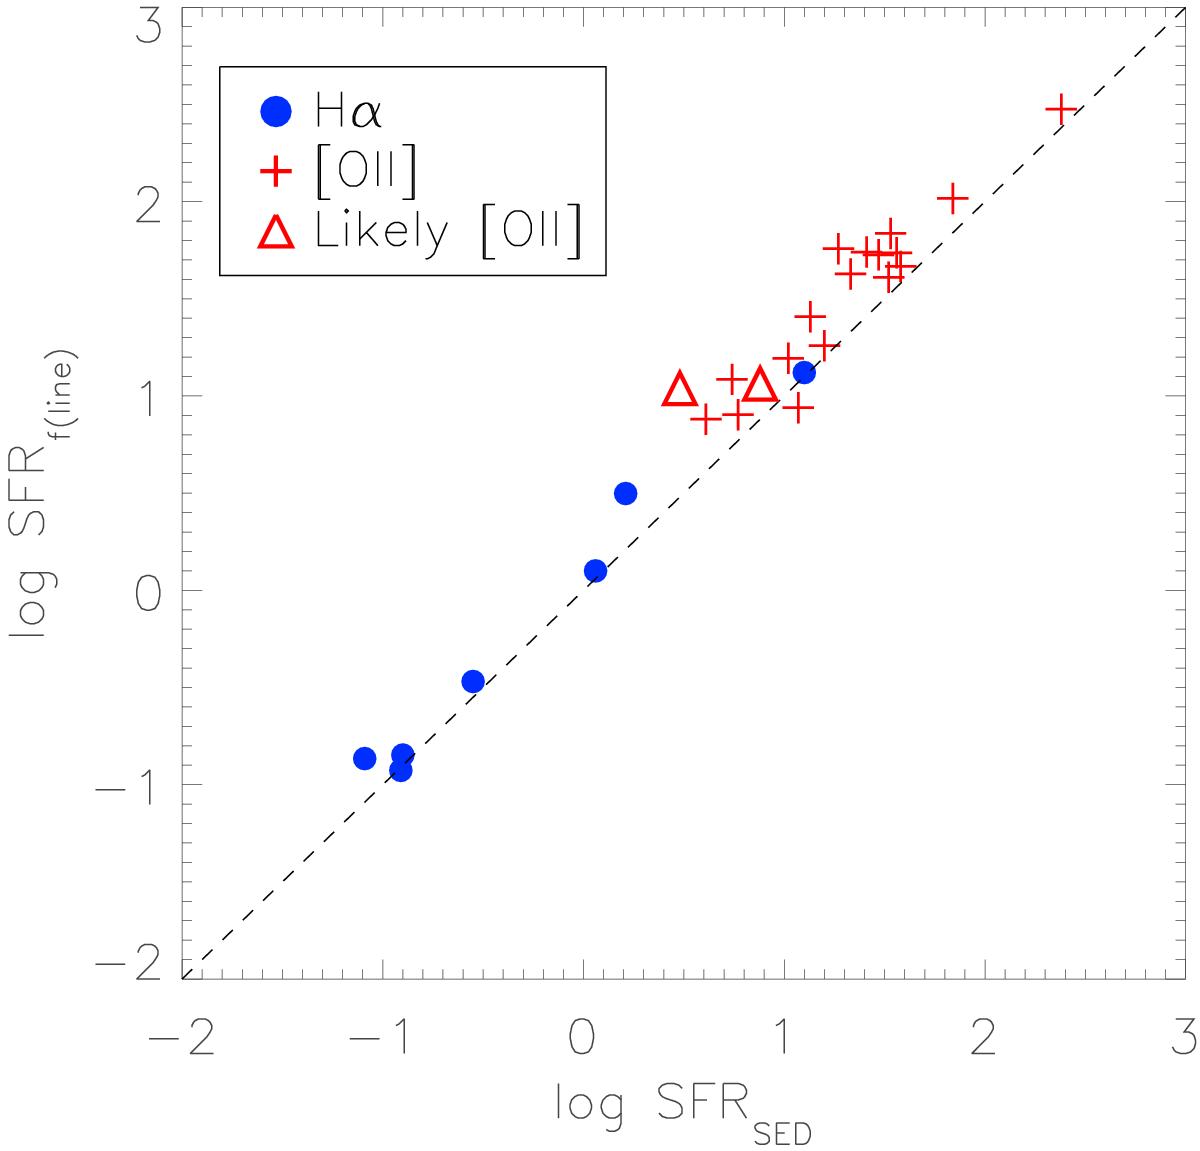
SFRs derived from the emission line flux plotted against the SFR values obtained from the SED fitting method. Symbol shapes and colours are similar to those in Fig. 10. The two methods show the offset of 0.19 ± 0.05 dex, which means that the values derived with two different methods are in excellent agreement for the entire sample.
Current usage metrics show cumulative count of Article Views (full-text article views including HTML views, PDF and ePub downloads, according to the available data) and Abstracts Views on Vision4Press platform.
Data correspond to usage on the plateform after 2015. The current usage metrics is available 48-96 hours after online publication and is updated daily on week days.
Initial download of the metrics may take a while.