Fig. 13
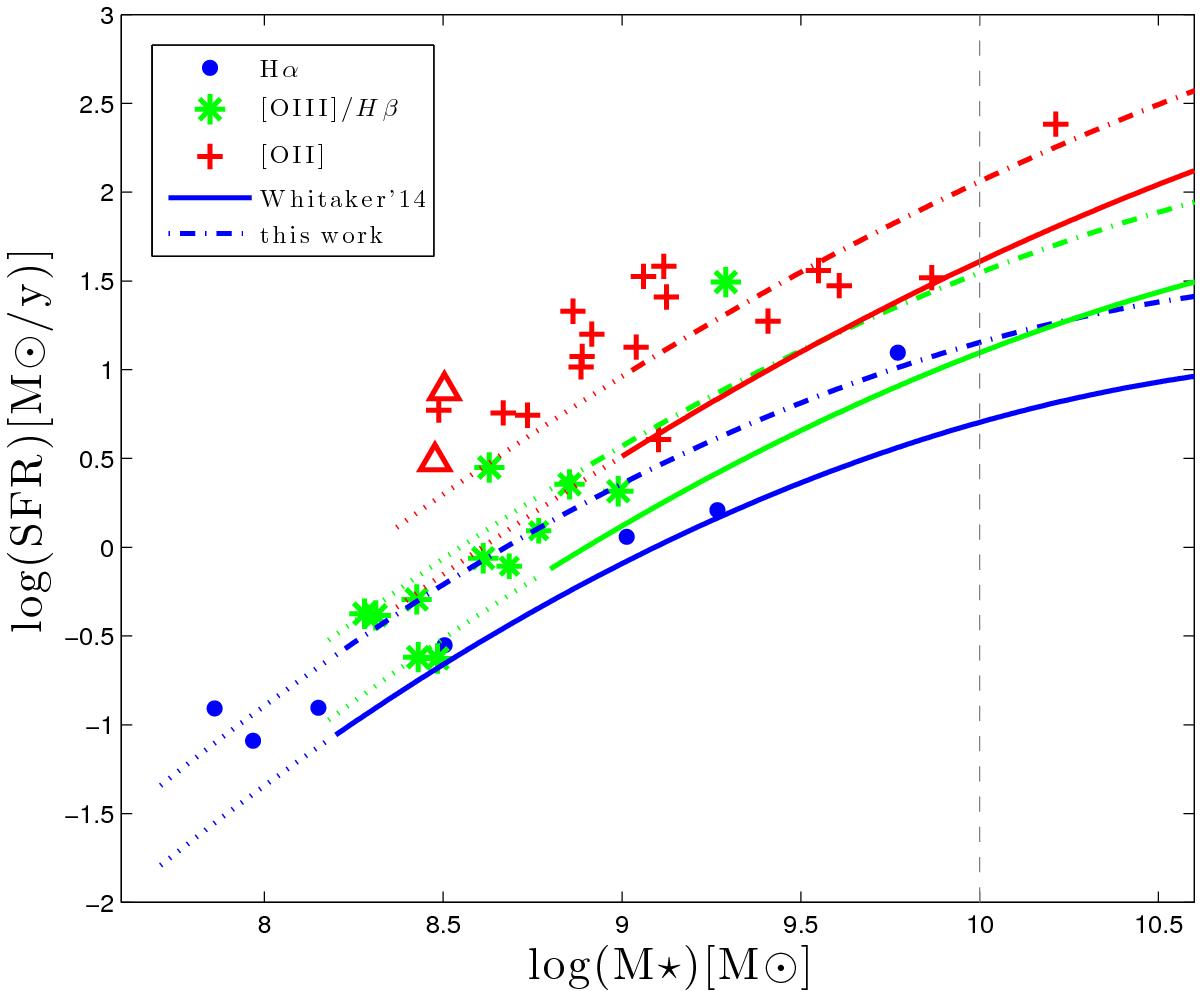
Similar to Fig. 12. Here we compare to the study by Whitaker et al. (2014) (solid lines), who also report a steepening towards low stellar masses. Their SFRs are seen to be lower, but adding 0.45 to their fits, we obtain a better fit to our data (dash-dotted curves). We do not see any evidence for shallower redshift evolution at low masses as they report. The dashed vertical line marks the division between their individual object (above 1010) and stacked object (below 1010) fits. Dotted curves are extrapolations of their fits where they had no data.
Current usage metrics show cumulative count of Article Views (full-text article views including HTML views, PDF and ePub downloads, according to the available data) and Abstracts Views on Vision4Press platform.
Data correspond to usage on the plateform after 2015. The current usage metrics is available 48-96 hours after online publication and is updated daily on week days.
Initial download of the metrics may take a while.