Free Access
Fig. 12
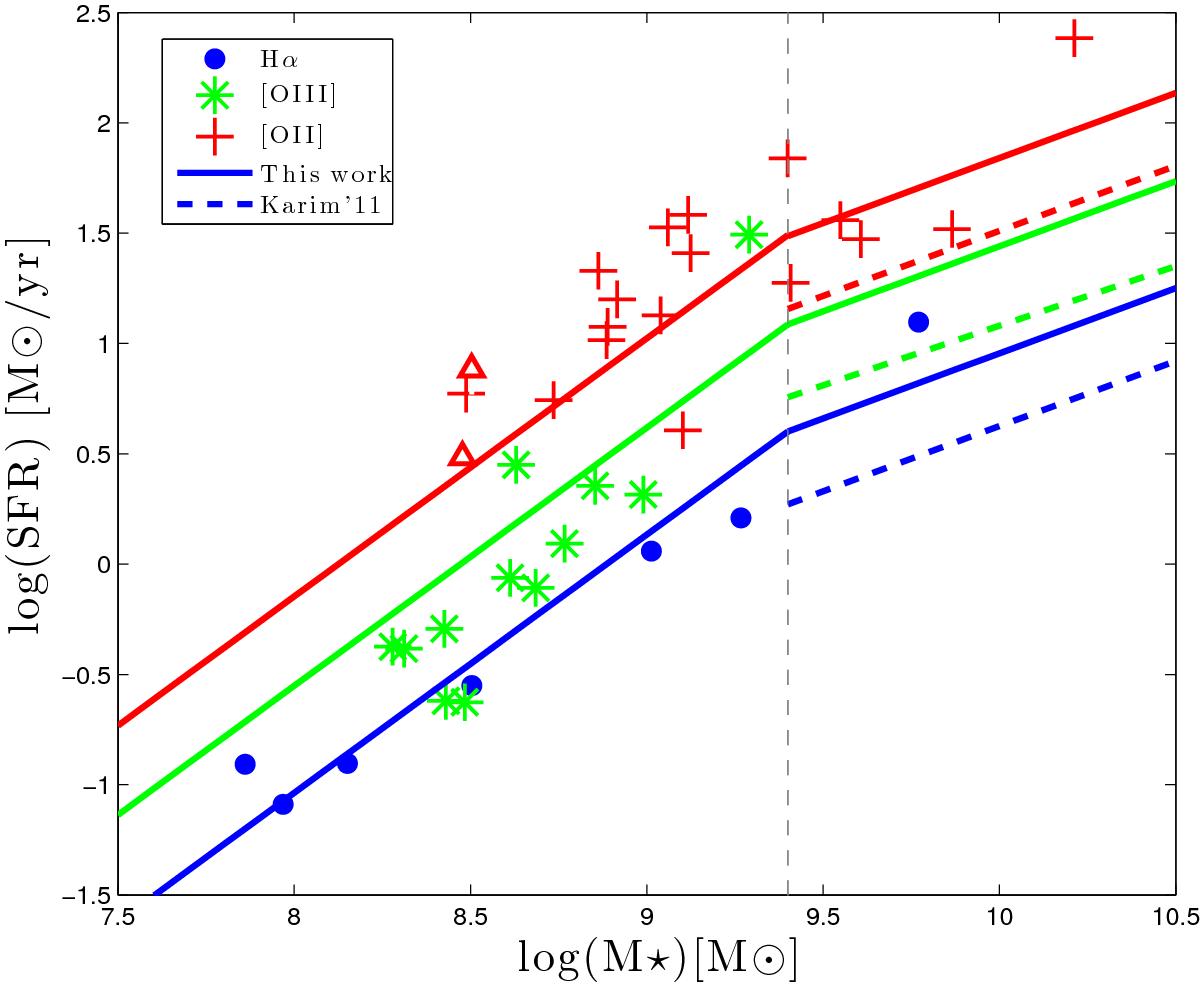
Similar to Fig. 10. Here we show only the Karim et al. (2011) fits (dashed lines) in the range above their lower mass bound. The full lines now show the best fit to our data of a “broken” MS with a steeper low mass slope.
Current usage metrics show cumulative count of Article Views (full-text article views including HTML views, PDF and ePub downloads, according to the available data) and Abstracts Views on Vision4Press platform.
Data correspond to usage on the plateform after 2015. The current usage metrics is available 48-96 hours after online publication and is updated daily on week days.
Initial download of the metrics may take a while.