Fig. 11
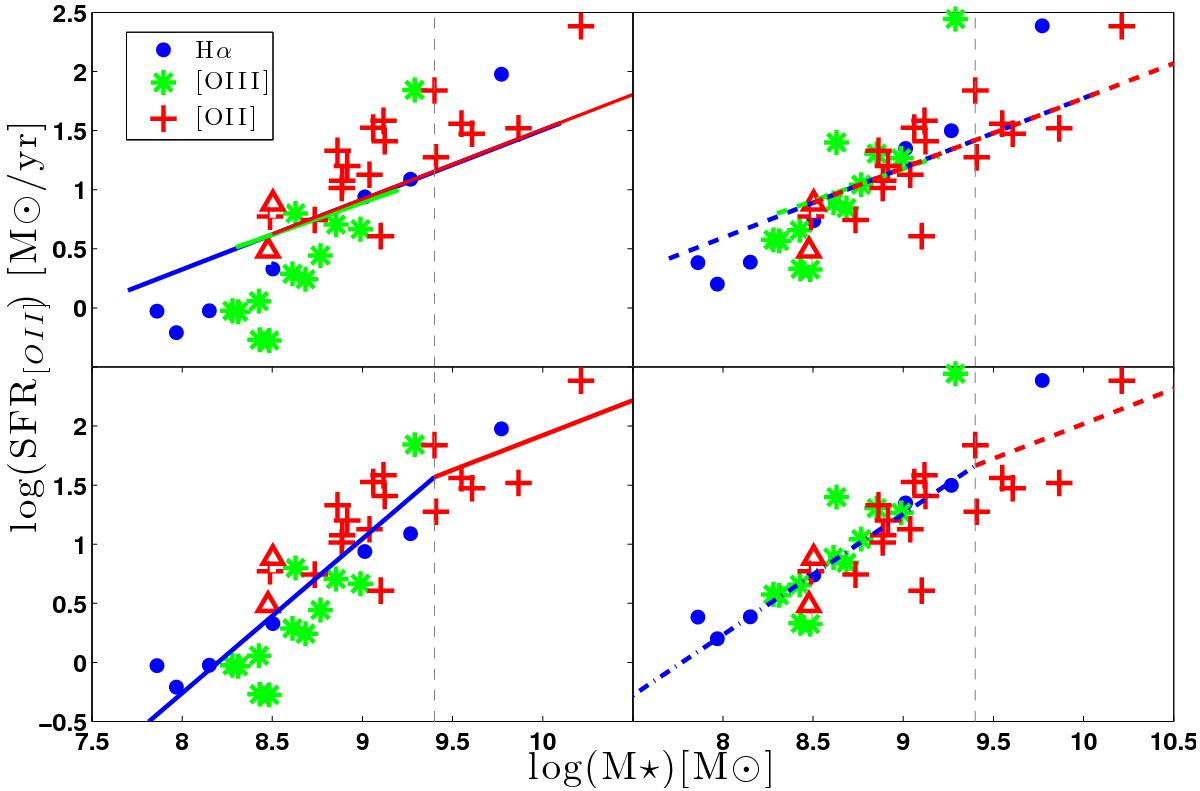
Upper two panels: same data and relations as in Fig. 10. Here we have shifted each redshift slice to remove the effect of redshift evolution. In the left column we have applied shifts to bring the blue and green solid lines on top of the red (i.e. applied redshift corrections as reported in Karim et al. 2011), in the right we did the same but used the dashed lines. Lower panels: best fit of broken MS relations. It is seen that under both assumptions, the relation steepens towards lower stellar masses.
Current usage metrics show cumulative count of Article Views (full-text article views including HTML views, PDF and ePub downloads, according to the available data) and Abstracts Views on Vision4Press platform.
Data correspond to usage on the plateform after 2015. The current usage metrics is available 48-96 hours after online publication and is updated daily on week days.
Initial download of the metrics may take a while.