Fig. 10
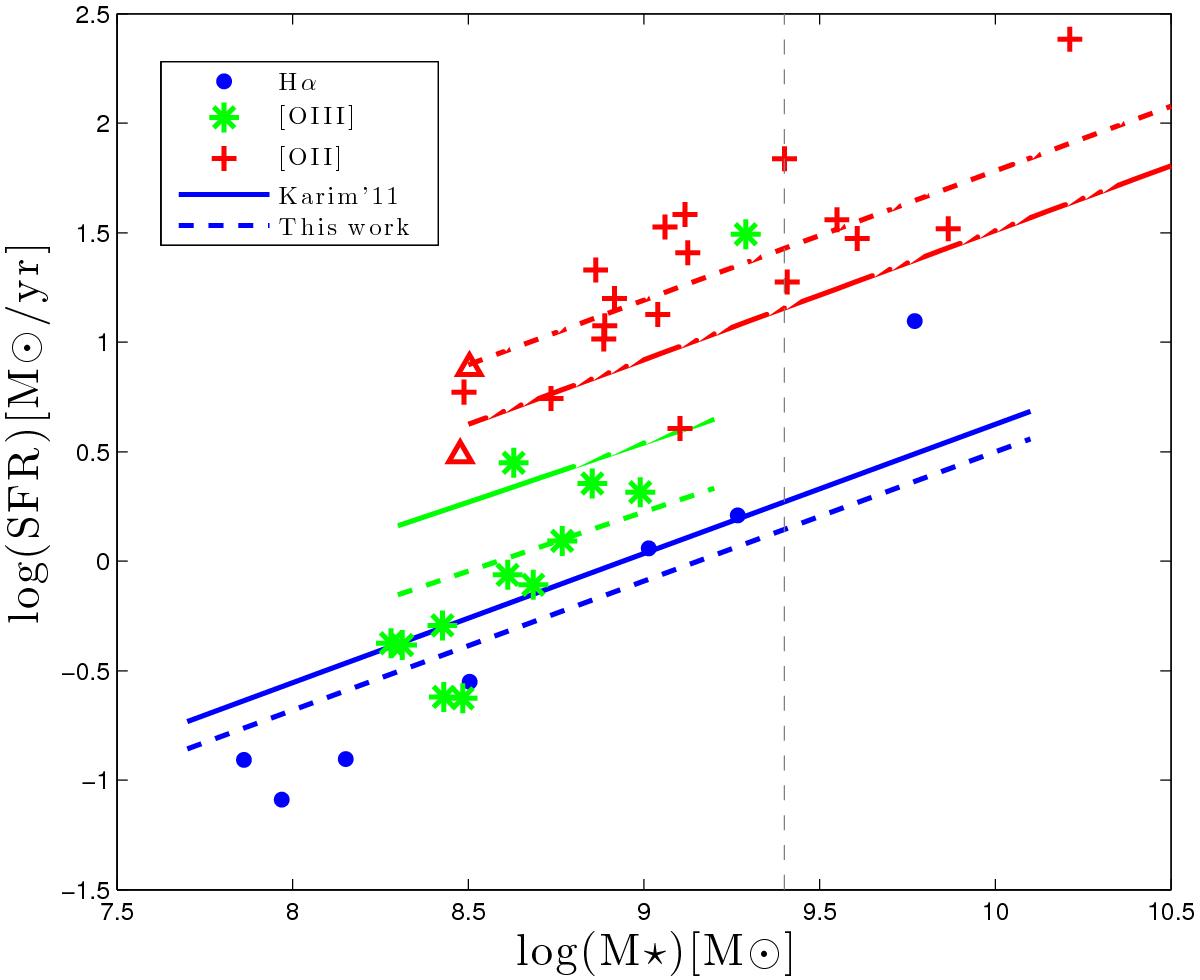
SFR vs. stellar mass of emission line selected galaxies, color-coded according to their redshift. The two red triangles mark objects with two redshift solutions (only primary solution shown). Solid lines show the relations reported by Karim et al. (2011). Dashed lines are the best fit of relations with the same slopes to our data. The vertical grey dashed line marks the lower mass limit of the Karim et al. (2011) sample.
Current usage metrics show cumulative count of Article Views (full-text article views including HTML views, PDF and ePub downloads, according to the available data) and Abstracts Views on Vision4Press platform.
Data correspond to usage on the plateform after 2015. The current usage metrics is available 48-96 hours after online publication and is updated daily on week days.
Initial download of the metrics may take a while.