Fig. 4
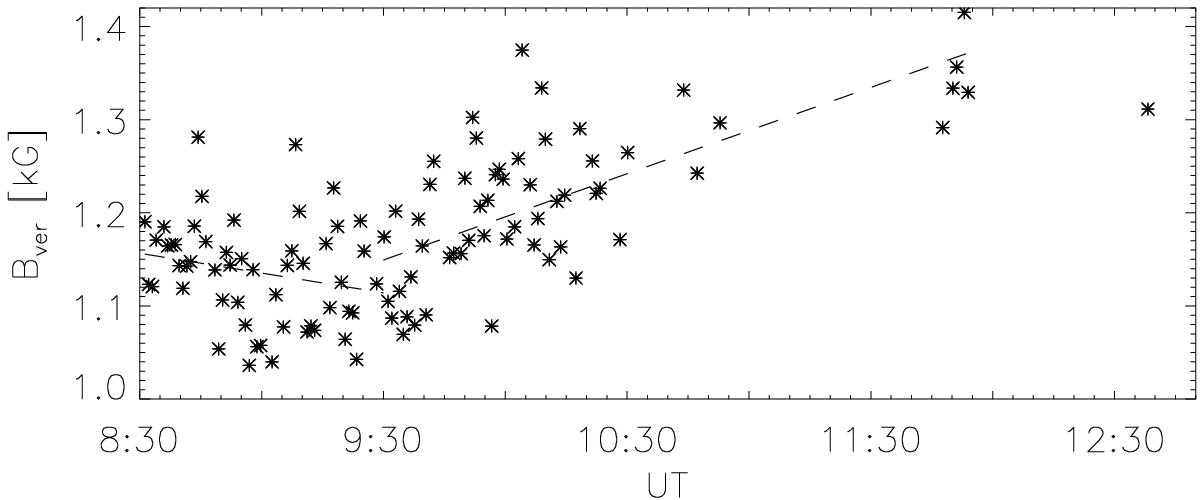
Temporal evolution of Bver. Symbols correspond to mean values of Bver along the UP boundary for each GFPI scan, where examples of the UP boundaries are marked by colour contours in Fig. 1. Dashed lines correspond to the linear fits of the obtained values between 8:30 UT and 9:30 UT (before the rapid penumbra evolution) and between 9:30 UT and 12:00 UT.
Current usage metrics show cumulative count of Article Views (full-text article views including HTML views, PDF and ePub downloads, according to the available data) and Abstracts Views on Vision4Press platform.
Data correspond to usage on the plateform after 2015. The current usage metrics is available 48-96 hours after online publication and is updated daily on week days.
Initial download of the metrics may take a while.