Fig. 3
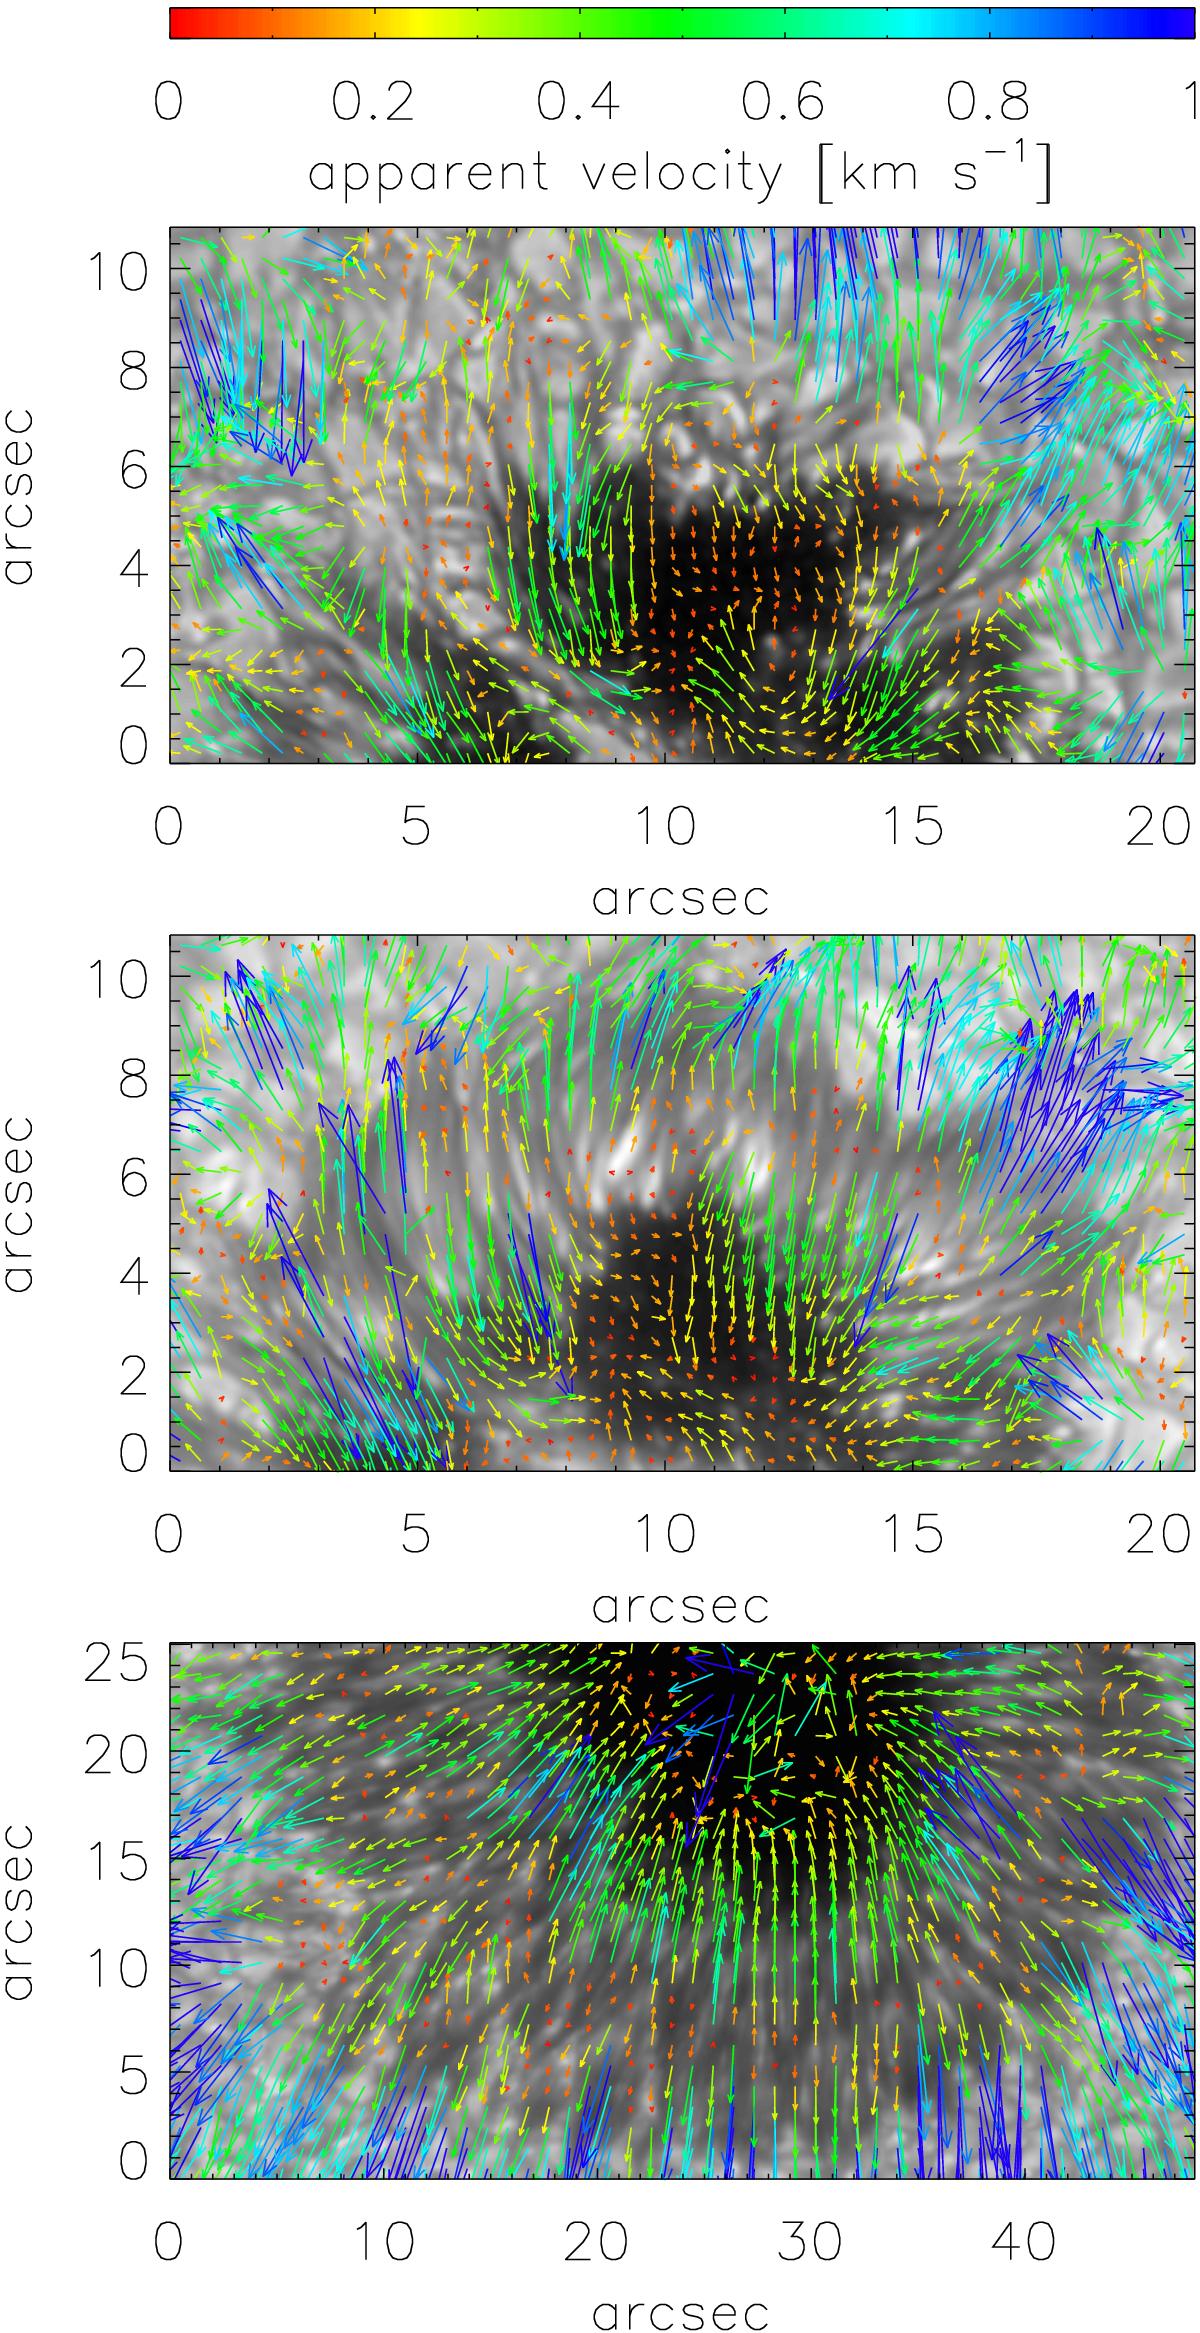
Apparent motions of brightness structures identified by the LCT method. The upper panel shows the apparent motions at the beginning of the penumbra formation (8:30–9:00 UT), the middle panel around the end of the penumbra formation (11:45–12:15 UT), and the bottom panel shows the apparent motions in developed penumbra for comparison.
Current usage metrics show cumulative count of Article Views (full-text article views including HTML views, PDF and ePub downloads, according to the available data) and Abstracts Views on Vision4Press platform.
Data correspond to usage on the plateform after 2015. The current usage metrics is available 48-96 hours after online publication and is updated daily on week days.
Initial download of the metrics may take a while.