Fig. 2
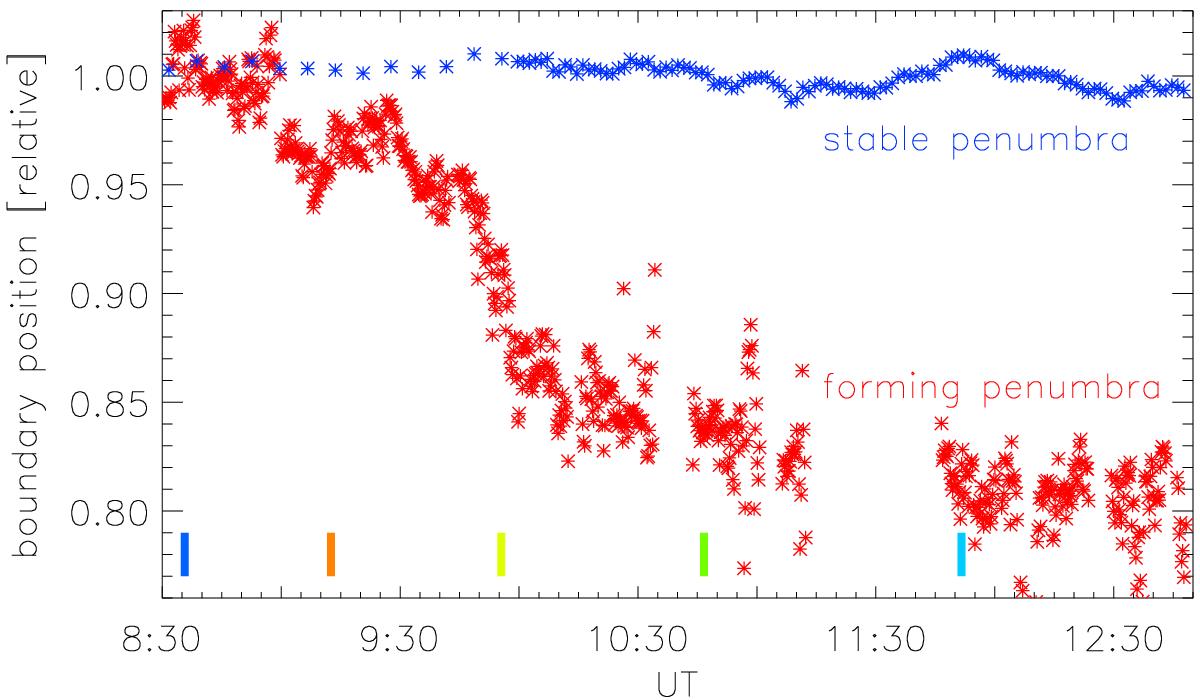
Evolution of the mean distance between the UP boundary and the sunspot centre (normalised to this distance). The red and blue symbols correspond to the forming and stable penumbra, respectively. The coloured vertical lines mark the times at which the contours in Fig. 1 are displayed. The UT time on the x-axis corresponds to the observations of the forming penumbra on July 4, 2009.
Current usage metrics show cumulative count of Article Views (full-text article views including HTML views, PDF and ePub downloads, according to the available data) and Abstracts Views on Vision4Press platform.
Data correspond to usage on the plateform after 2015. The current usage metrics is available 48-96 hours after online publication and is updated daily on week days.
Initial download of the metrics may take a while.