Fig. 6
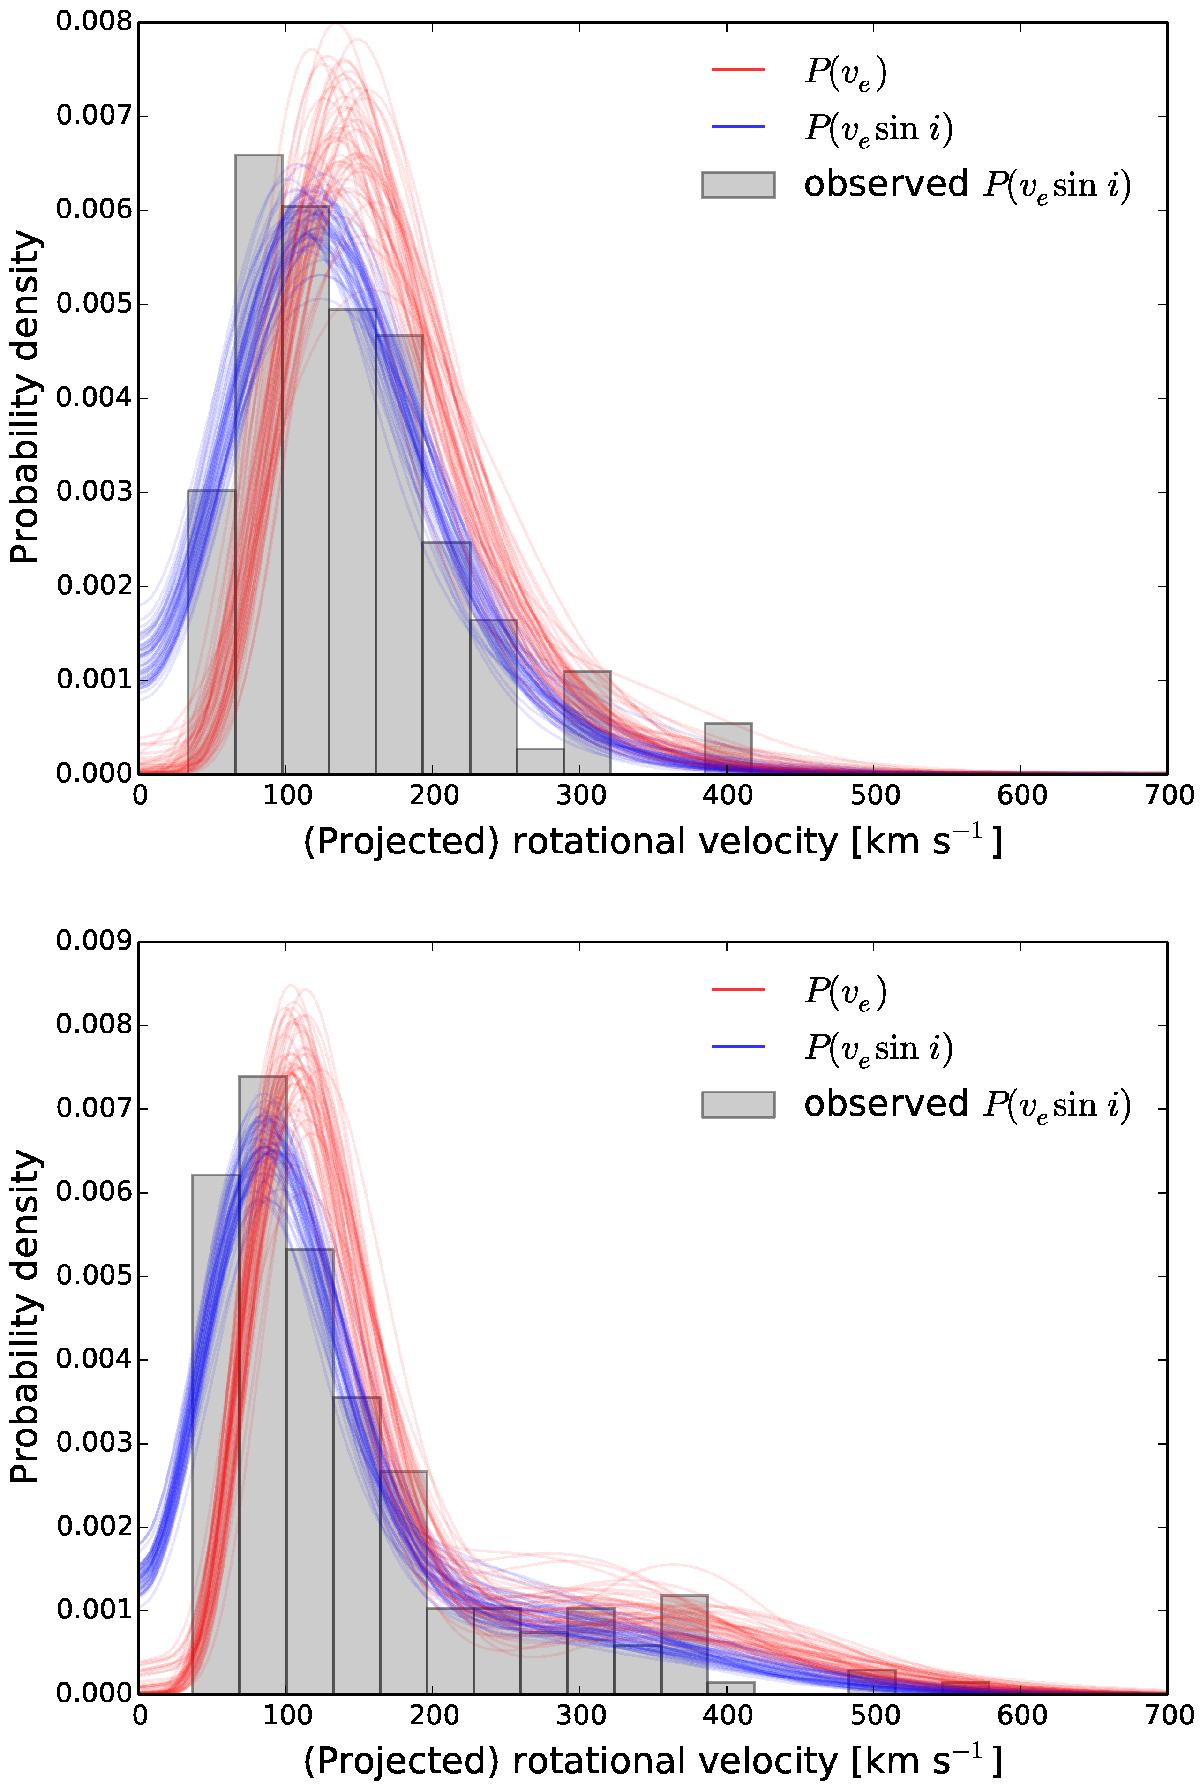
Rotational velocity distributions for 50 random samples of the MCMC chain for the primaries (upper panel) and the single stars (lower panel). The intrinsic rotational velocity distributions are shown in red. In blue we show the corresponding distributions projected (assuming the sini distribution inferred for the detected binaries in VFTS for the primaries and a random orientation of the system in 3D space for the single stars) and convolved with a Gaussian error distribution with σv = 20 kms-1. Although the observed data is represented here by a histogram, the fit to the data is performed discretely, i.e., without any binning. The histogram bins are chosen according to Knuth’s rule (Knuth 2006).
Current usage metrics show cumulative count of Article Views (full-text article views including HTML views, PDF and ePub downloads, according to the available data) and Abstracts Views on Vision4Press platform.
Data correspond to usage on the plateform after 2015. The current usage metrics is available 48-96 hours after online publication and is updated daily on week days.
Initial download of the metrics may take a while.