Free Access
Fig. 9
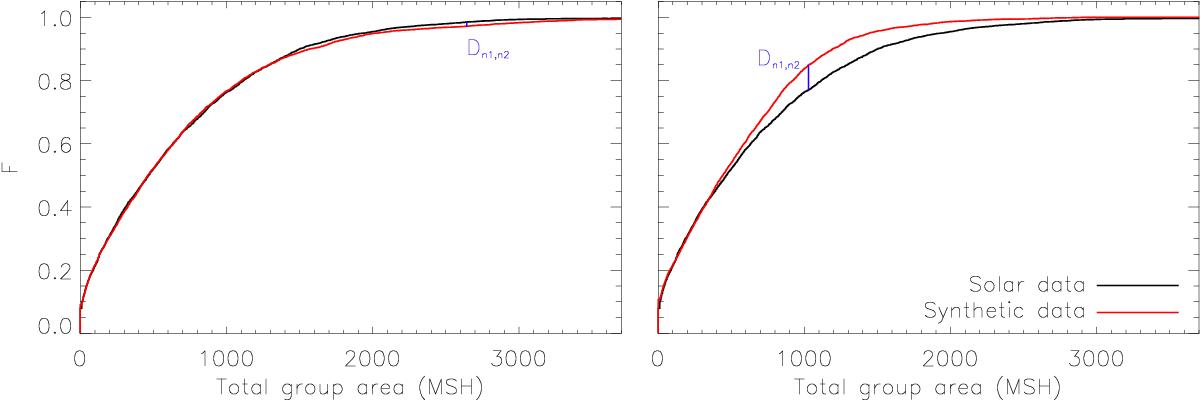
Cumulative distribution functions of the synthetic (red) and real data (black) for the total group areas of a reconstruction obtained from the current version of the model (left panel; Dn1,n2 ~ 0.0141) and a reconstruction obtained when assuming the GW rule for the area-lifetime relation (right panel; Dn1,n2 ~ 0.0798).
Current usage metrics show cumulative count of Article Views (full-text article views including HTML views, PDF and ePub downloads, according to the available data) and Abstracts Views on Vision4Press platform.
Data correspond to usage on the plateform after 2015. The current usage metrics is available 48-96 hours after online publication and is updated daily on week days.
Initial download of the metrics may take a while.