Fig. 3
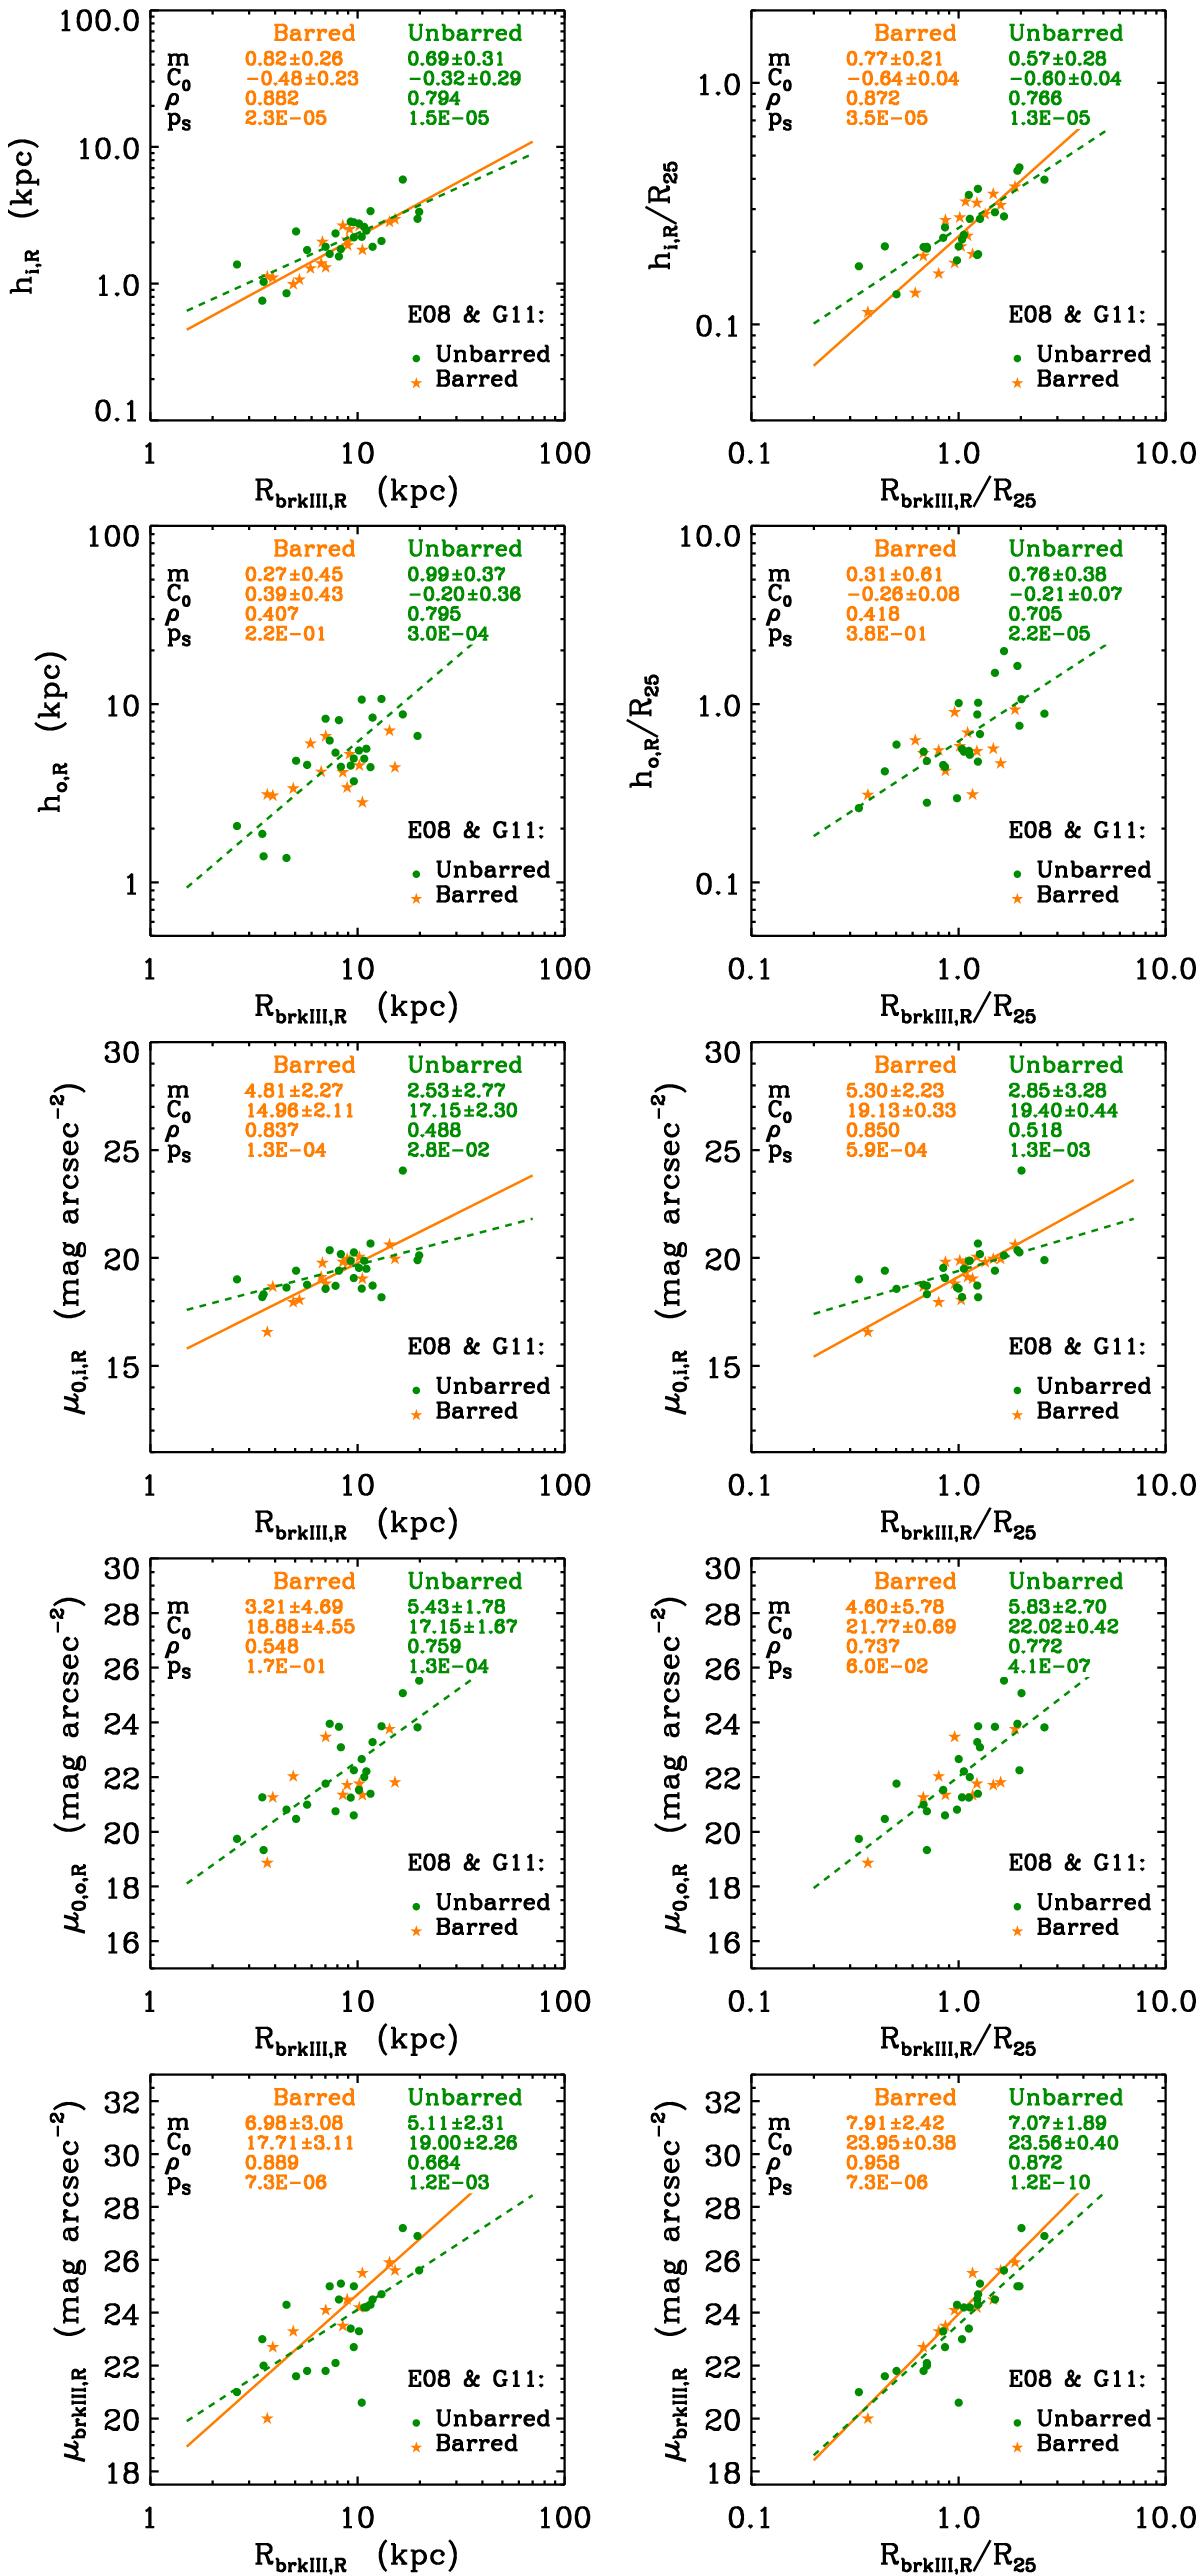
Same as Fig. 1, but for barred and unbarred galaxies in the R band (see Tables 2−4). The linear fits performed to barred and unbarred galaxies are overplotted only if they are significant (yellow solid line: barred galaxies, green dashed line: unbarred galaxies). The results of the linear fits are indicated at the top of each panel. The errors of the fits shown in the panels have been symmetrized for simplicity (the results are available in the corresponding tables). See the legend in the panels.
Current usage metrics show cumulative count of Article Views (full-text article views including HTML views, PDF and ePub downloads, according to the available data) and Abstracts Views on Vision4Press platform.
Data correspond to usage on the plateform after 2015. The current usage metrics is available 48-96 hours after online publication and is updated daily on week days.
Initial download of the metrics may take a while.