Fig. 2
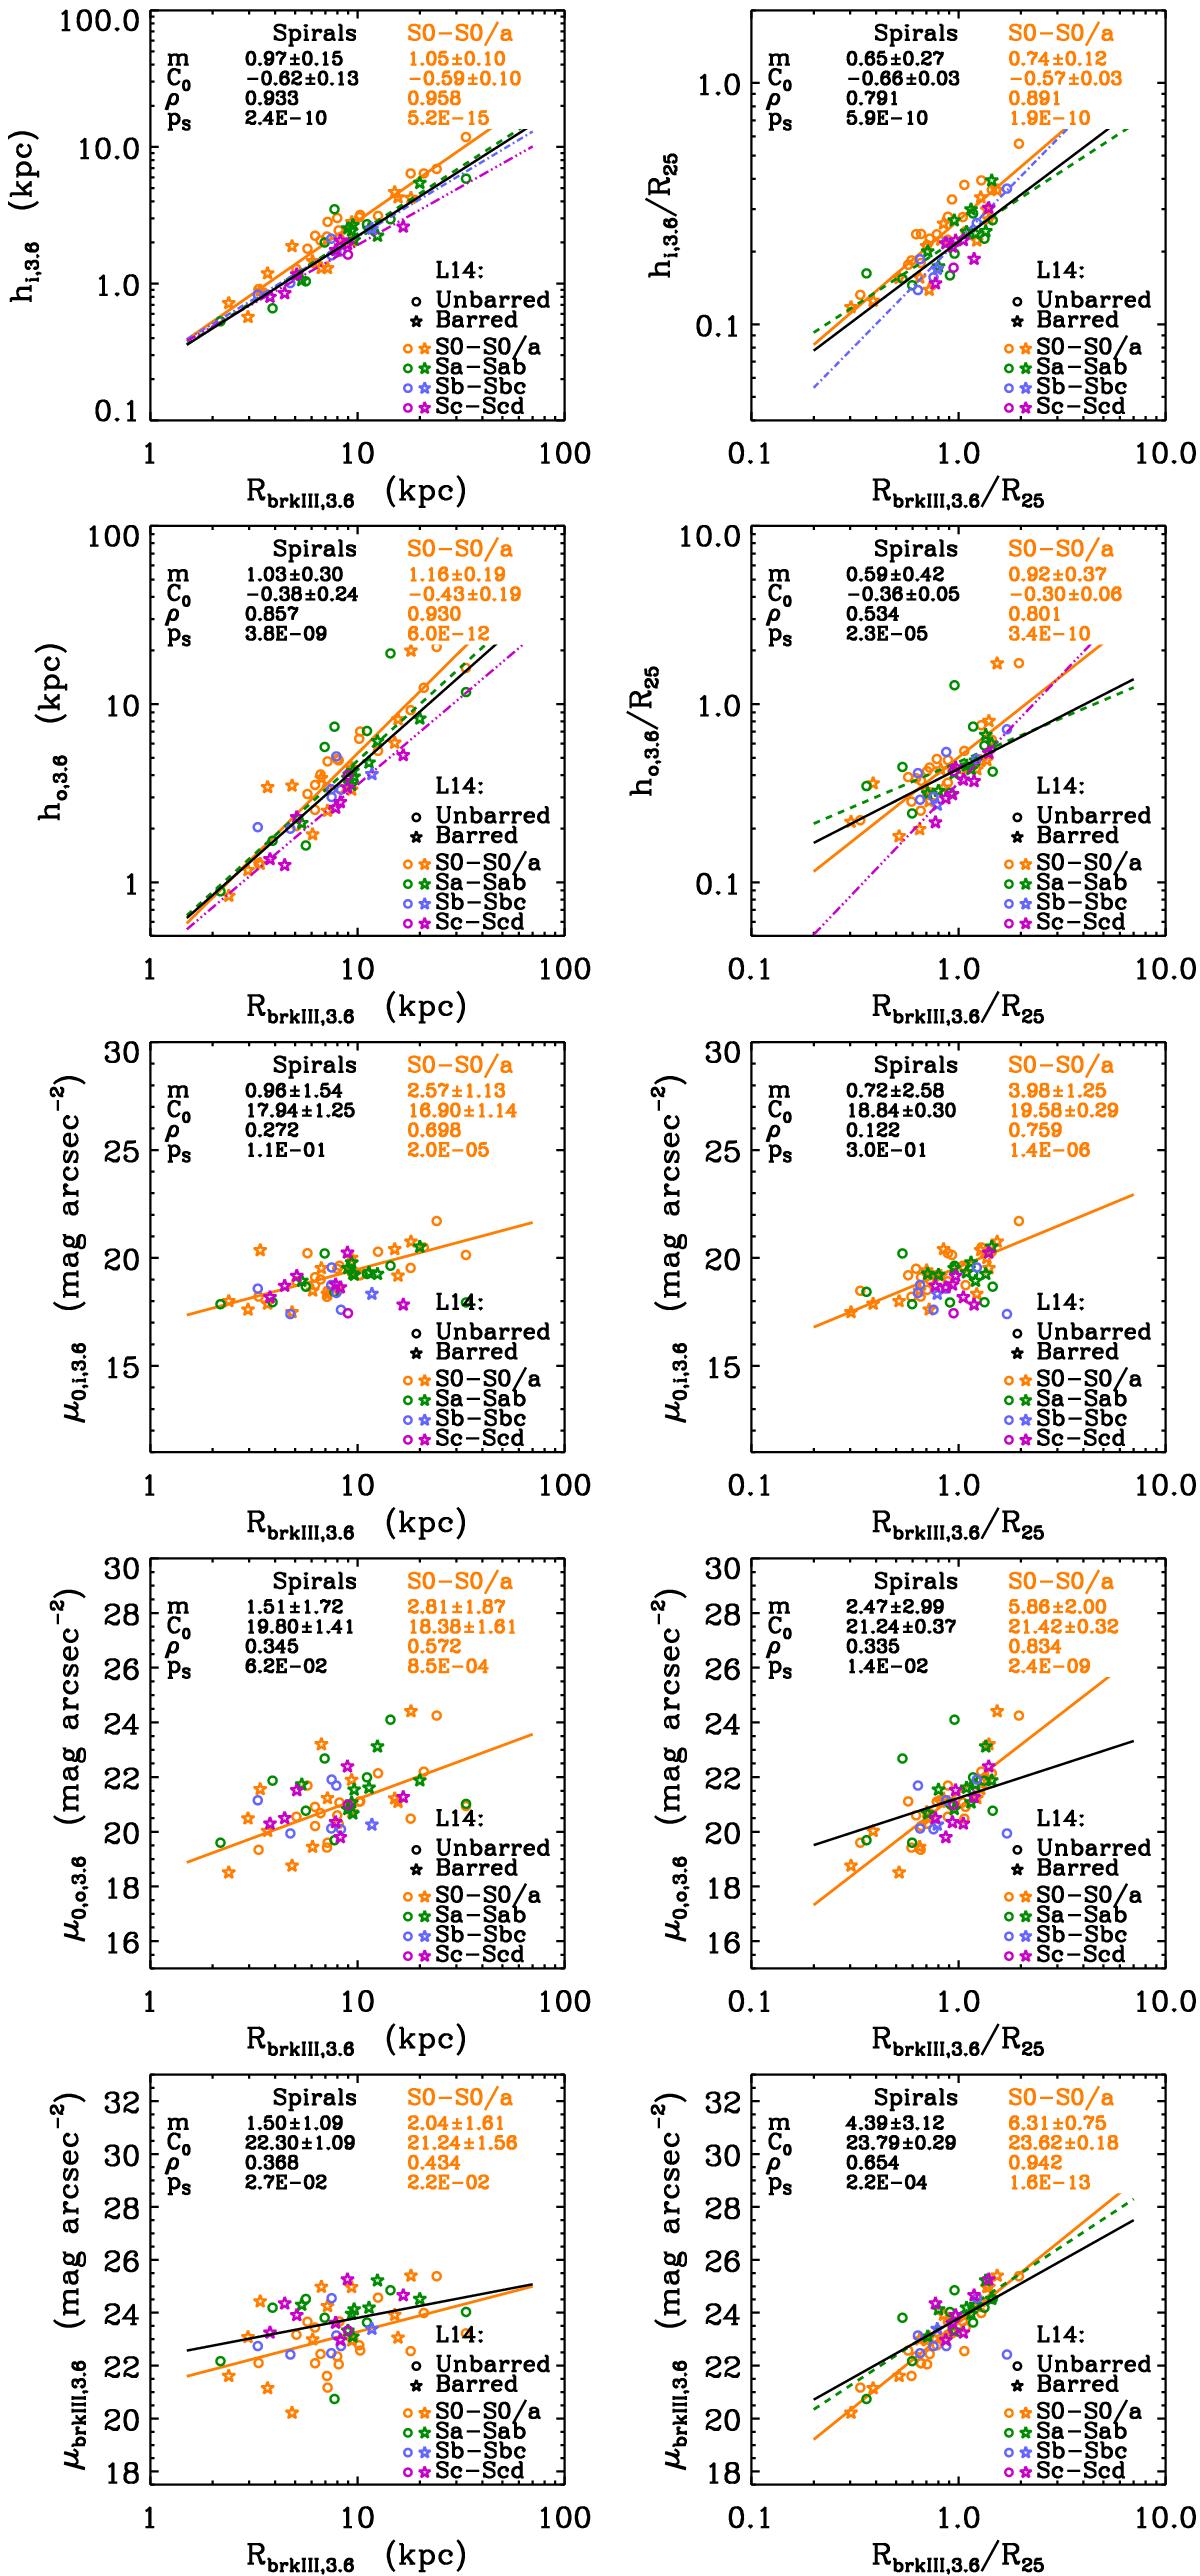
Same as Fig. 1, but for local anti-truncated S0–Scd galaxies in the 3.6 μm band from the L14 sample (see Tables 2−4). Left: trends with RbrkIII. Right: trends with RbrkIII/R25. The linear fits performed to each galaxy type are overplotted only if they are significant (orange thick solid line: S0–S0/a, grey thin solid line: all spirals, green dashed line: Sa-Sab, blue dash-dotted line: Sb–Sbc, purple three dotted-dashed line: Sc-Scd). The results of the linear fits performed for the spirals and S0s are indicated at the top of each panel. The errors of the fits shown in the panels have been symmetrized for simplicity (the results are in the corresponding tables). See the legend in the panels.
Current usage metrics show cumulative count of Article Views (full-text article views including HTML views, PDF and ePub downloads, according to the available data) and Abstracts Views on Vision4Press platform.
Data correspond to usage on the plateform after 2015. The current usage metrics is available 48-96 hours after online publication and is updated daily on week days.
Initial download of the metrics may take a while.