Fig. 11
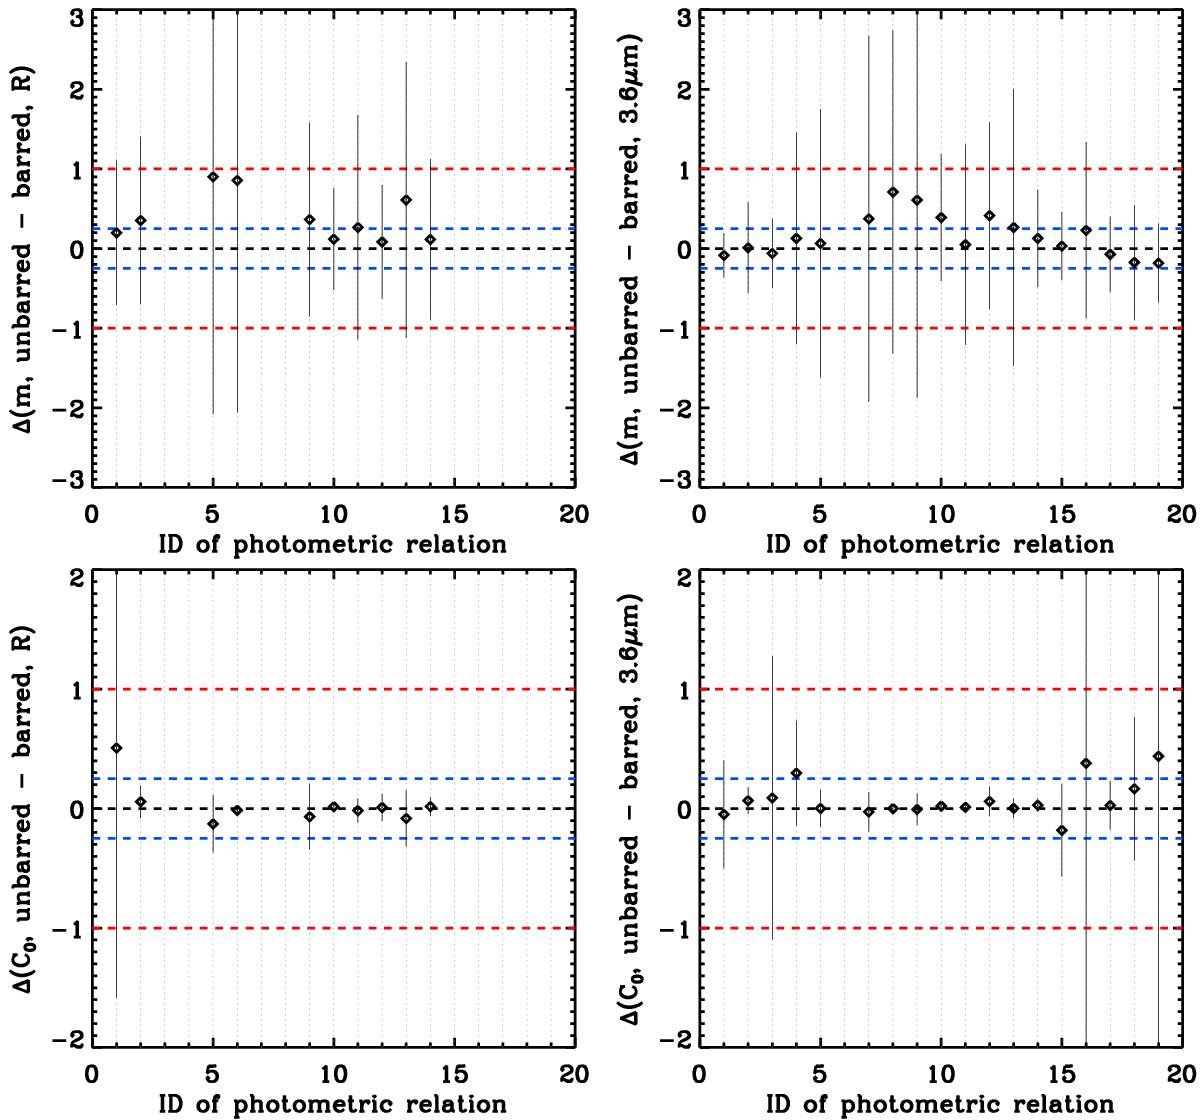
Comparison of the relative differences of slope (m) and Y-intercept (C0) values obtained from the linear fits performed to the barred galaxies vs. those performed to the unbarred galaxies in the photometric planes of Type-III galaxies being studied. Left: trends for the R-band data by E08 and G11. Right: trends for the 3.6 μm data by L14. See the caption and legend of Fig. 10.
Current usage metrics show cumulative count of Article Views (full-text article views including HTML views, PDF and ePub downloads, according to the available data) and Abstracts Views on Vision4Press platform.
Data correspond to usage on the plateform after 2015. The current usage metrics is available 48-96 hours after online publication and is updated daily on week days.
Initial download of the metrics may take a while.