Fig. 10
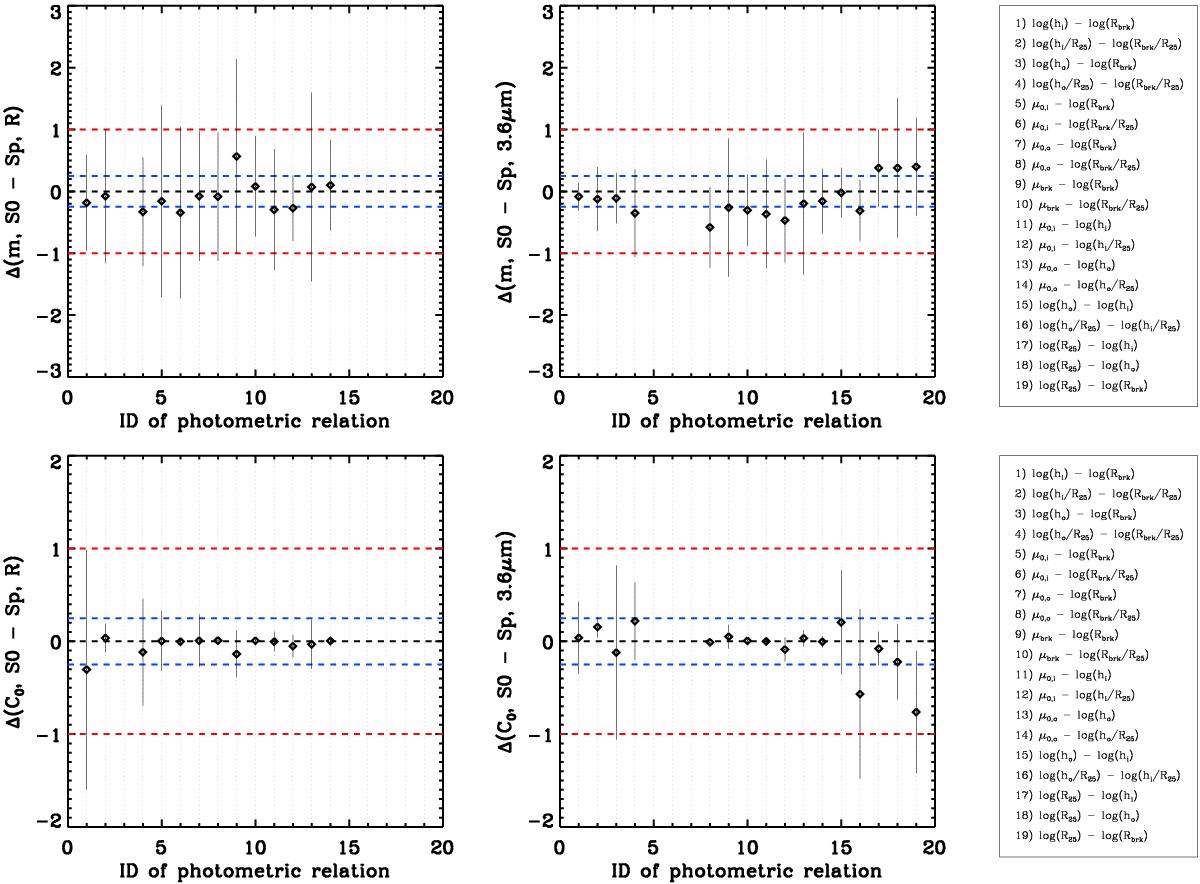
Comparison of the relative differences of slope (m) and Y-intercept (C0) values obtained from the linear fits performed to Type-III spirals vs. those performed to Type-III S0 galaxies in the photometric planes of Figs. 1–9. Left panels: Δ(m) and Δ(C0) for the R-band data. Right panels: Δ(m) and Δ(C0) for the 3.6 μm data. Only the linear fits of the photometric trends that are significant according to the Spearman rank correlation test in the two datasets being compared are plotted. Blue and red horizontal dashed lines: limiting values such that the differences in m and C0 fitted to the S0s and spirals reach 25% and 100% of their values, respectively. See the key on the right for the numbers in the X-axis representing each photometric relation. Their numerical identifiers are the same as those used in Tables 2–7.
Current usage metrics show cumulative count of Article Views (full-text article views including HTML views, PDF and ePub downloads, according to the available data) and Abstracts Views on Vision4Press platform.
Data correspond to usage on the plateform after 2015. The current usage metrics is available 48-96 hours after online publication and is updated daily on week days.
Initial download of the metrics may take a while.