Fig. 8
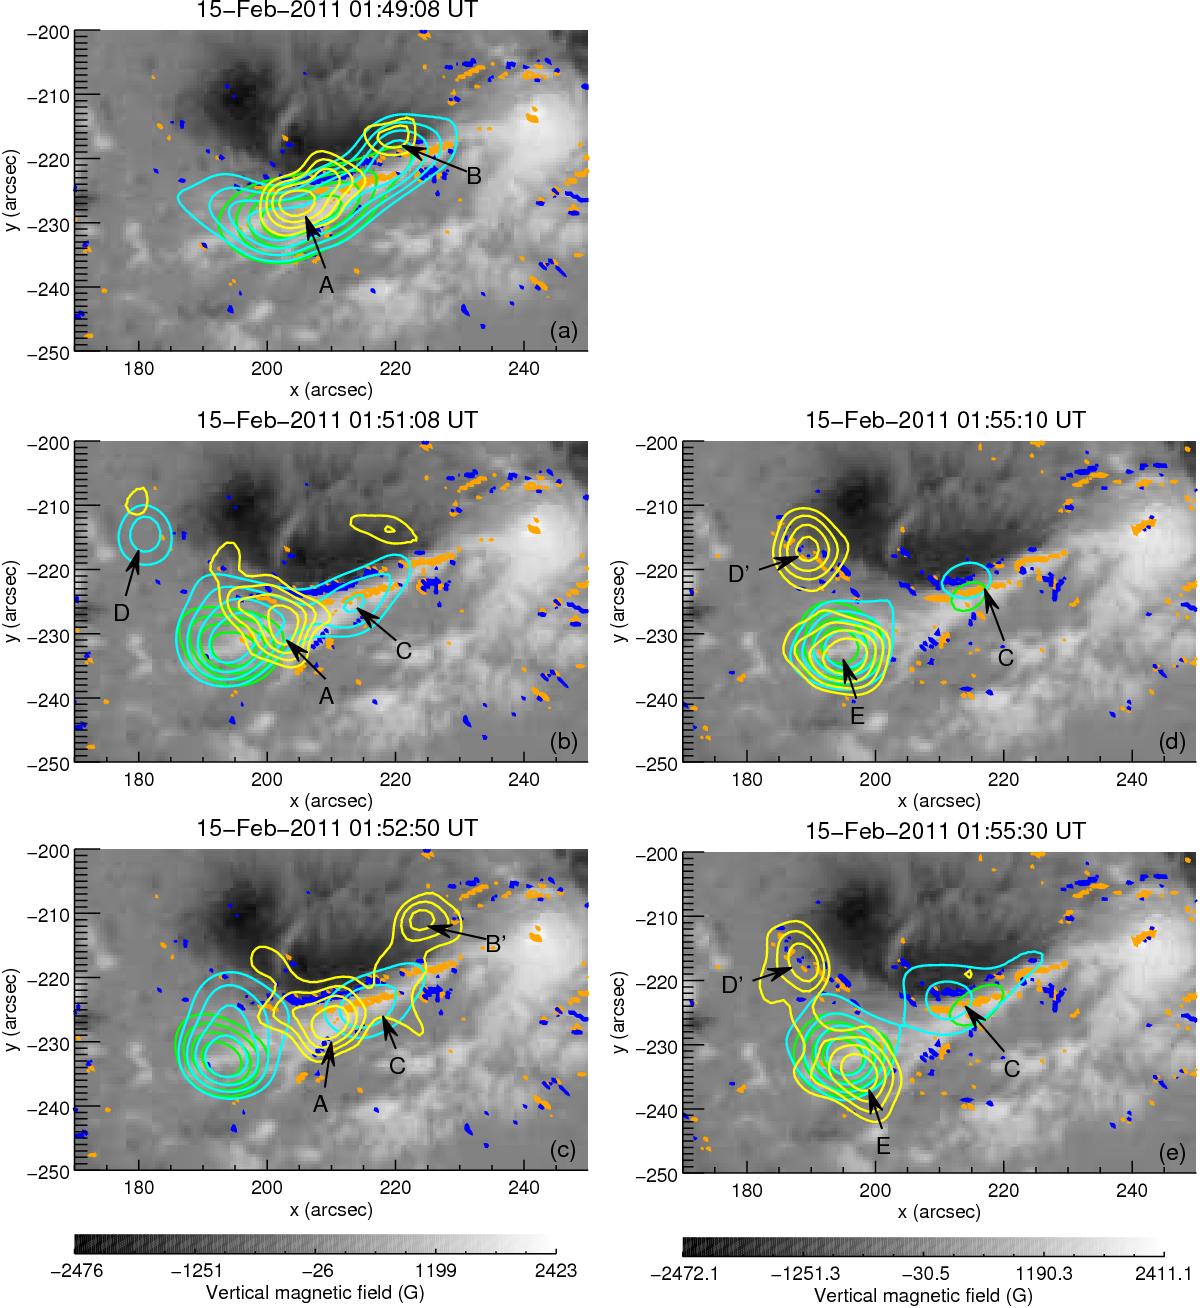
Magnetic field maps (in grey scale) from SDO/HMI of a part of the active region 11158, on February 15, 2011, at 01:48:00 UT (left) and 02:00:00 UT (right). The orange and blue contours represent the positive and negative vertical electric current densities, respectively, with amplitude >100 mA/m2. The green, cyan, and yellow contours are the X-ray emissions (from RHESSI) at 12−25 keV, 25−50 keV, and 50−100 keV, respectively, integrated between a) 01:49:00 and 01:49:16; b) 01:51:00 and 01:51:16; c) 01:52:42 and 01:52:58; d) 01:55:02 and 01:55:18; and e) 01:55:22 and 01:55:38 UT. X-rays have been imaged with the algorithm CLEAN, using collimators 2, 3, 4, 5, 6, 7, 8, and 9. The contours correspond to 60, 70, 80, and 90% of the maximum for the X-ray emissions.
Current usage metrics show cumulative count of Article Views (full-text article views including HTML views, PDF and ePub downloads, according to the available data) and Abstracts Views on Vision4Press platform.
Data correspond to usage on the plateform after 2015. The current usage metrics is available 48-96 hours after online publication and is updated daily on week days.
Initial download of the metrics may take a while.