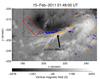
Fig. 7
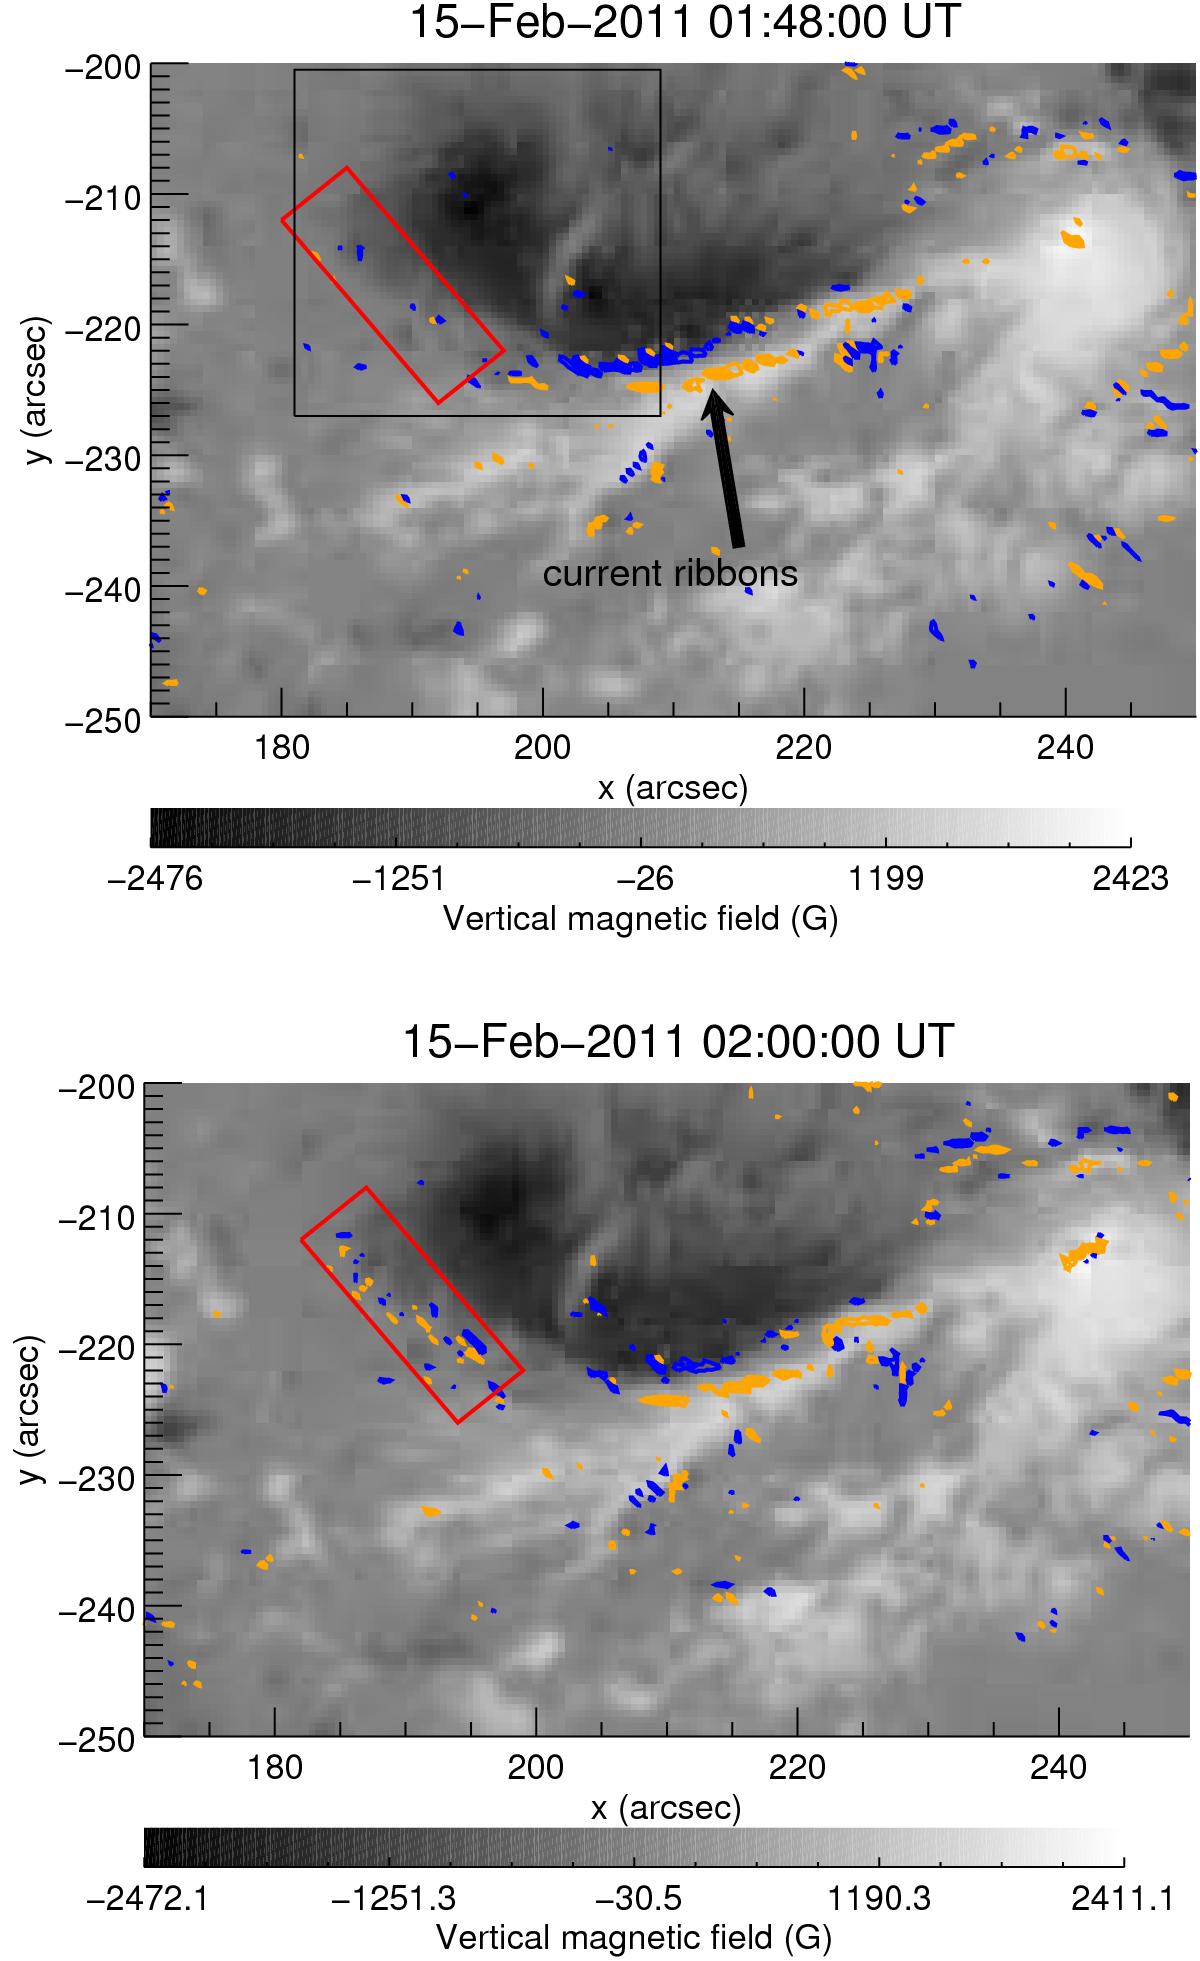
Magnetic field maps (in grey scale) from SDO/HMI of a part of the active region 11158, on February 15, 2011, at 01:48:00 UT (top) and 02:00:00 UT (bottom), represented in the plane-of-sky. The orange and blue contours represent the positive and negative vertical electric current densities, respectively, with the magnitude greater than 100 mA/m2. The black arrow in the top panel indicates the current ribbons extending from 195 arcsec to 230 arcsec in the x-direction, and lying between −220 arcsec and −230 arcsec in the y-direction. The red box shows the primary difference between the two maps: in this box, the total negative vertical current density varies from − 974.9 × 10⁹ A to − 1062 × 109 A, and the total positive vertical current density varies from + 616.9 × 10⁹ A to + 762.4 × 10⁹ A. Therefore, the total increase of vertical current density is of 232 × 109 A for the area of the red box. This represents an increase of 15% in the total current density in this area.
Current usage metrics show cumulative count of Article Views (full-text article views including HTML views, PDF and ePub downloads, according to the available data) and Abstracts Views on Vision4Press platform.
Data correspond to usage on the plateform after 2015. The current usage metrics is available 48-96 hours after online publication and is updated daily on week days.
Initial download of the metrics may take a while.