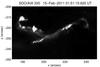
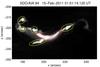
Fig. 5
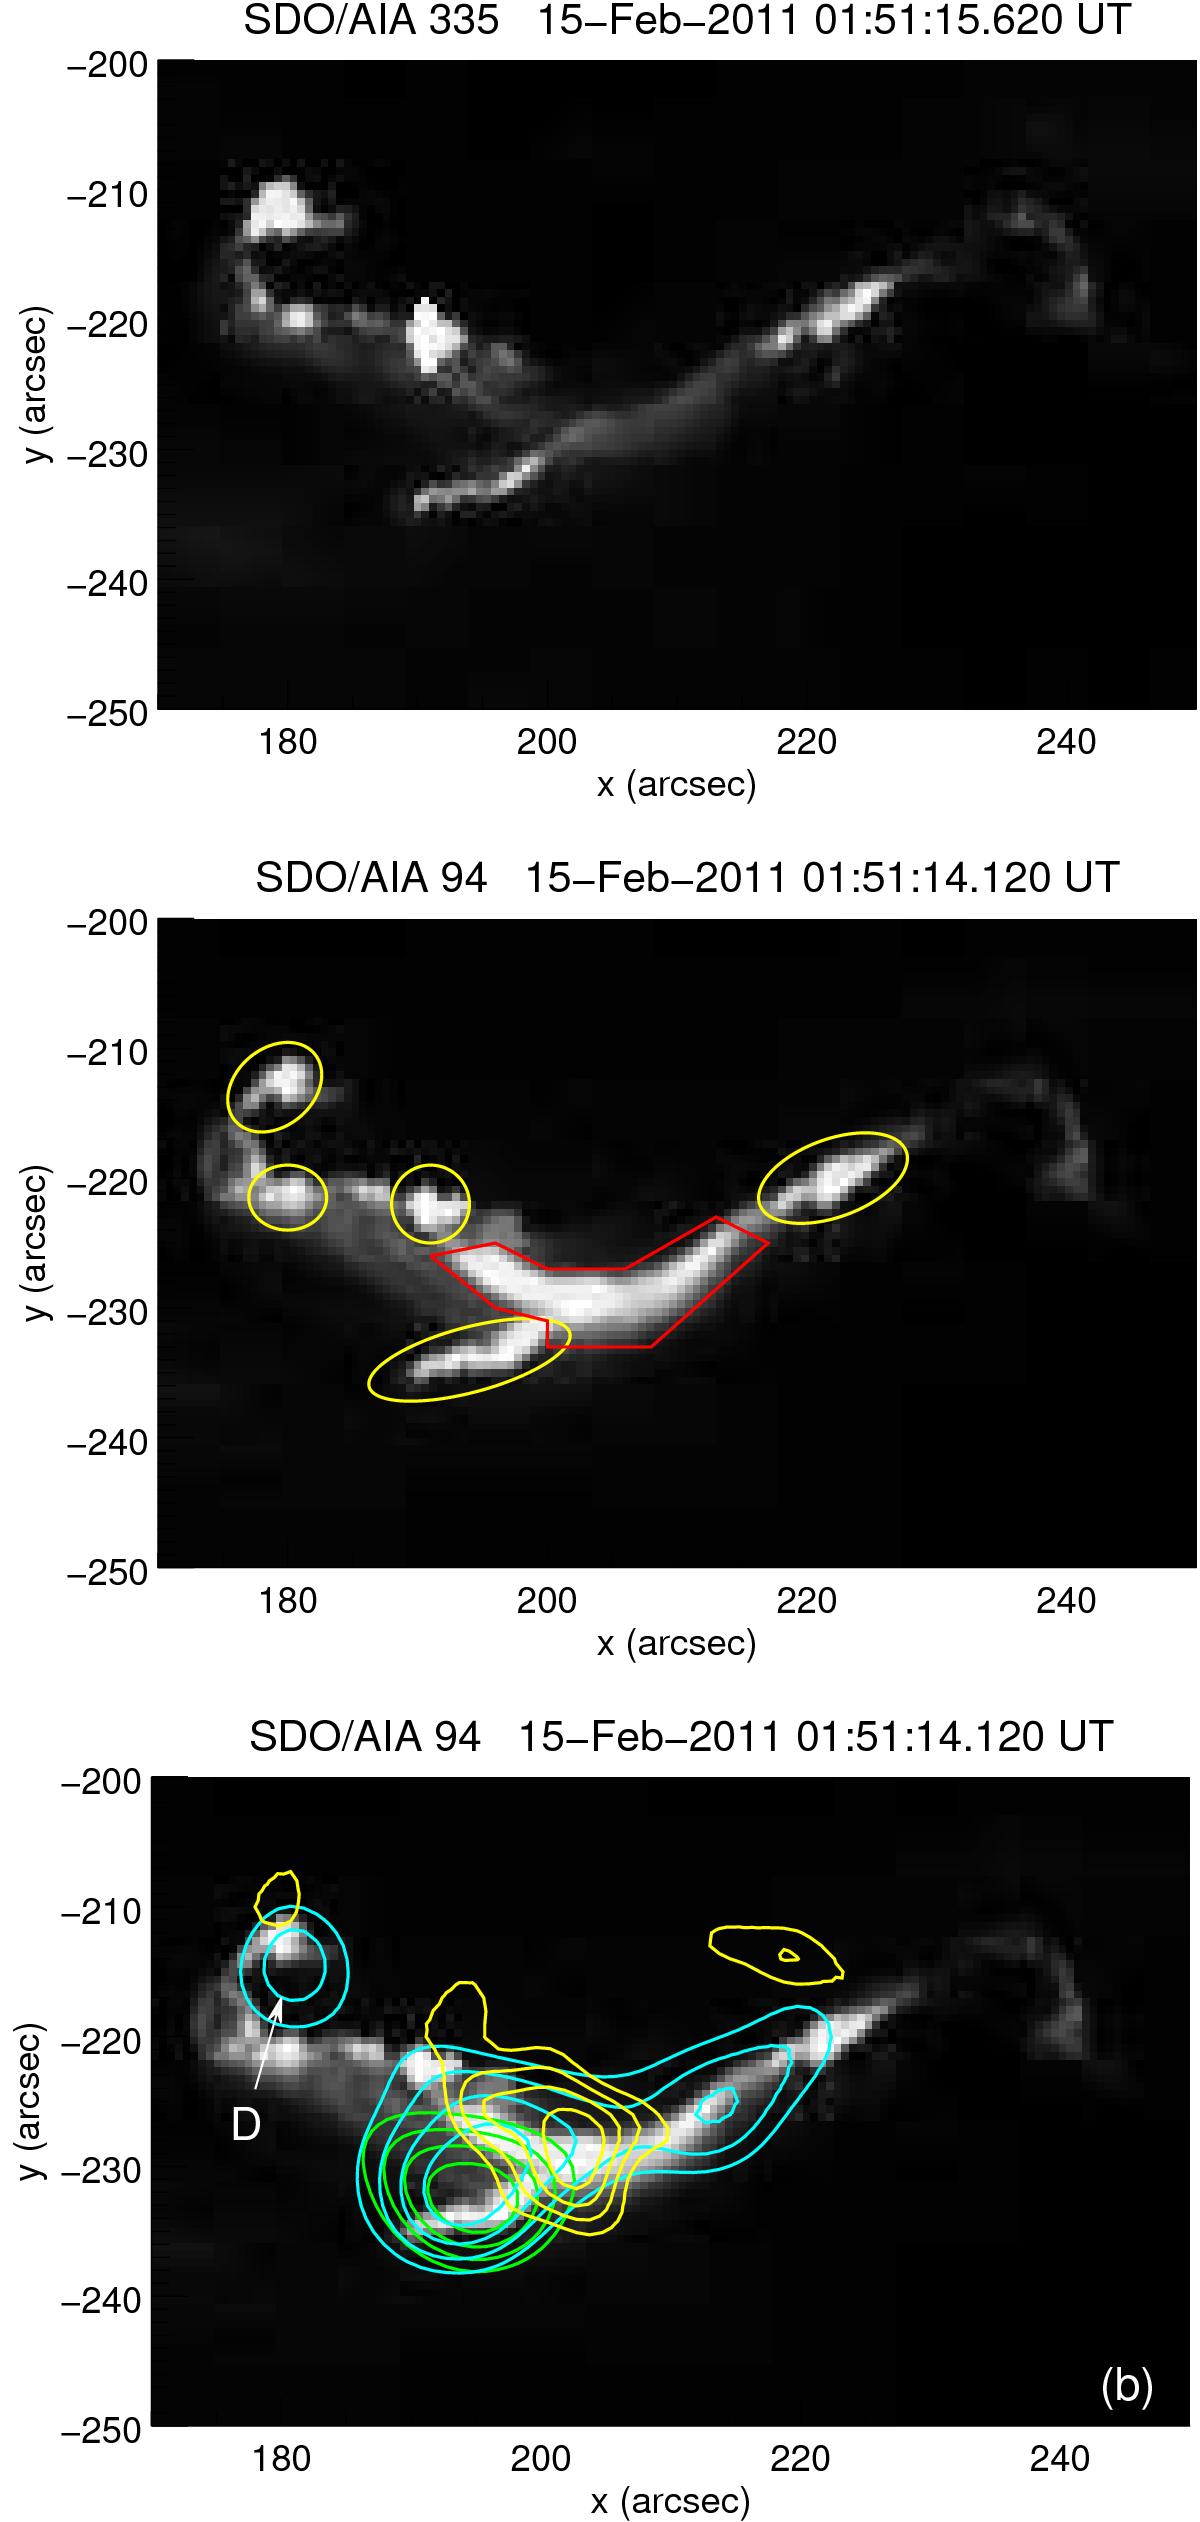
SDO/AIA image at 335 Å (top) and 94 Å (middle and bottom), on February 15, 2011, around 01:51:15 UT. In the middle image, the region bordered in red is not clearly detected at 335 Å (most probably the plasma temperature is higher than 6 × 10⁶ K; see text); regions bordered in yellow are seen in both channels (probably the plasma temperature is close to 1 × 10⁶ K). Bottom: image at 94 Å on which RHESSI contours are overlaid. The green, blue, and yellow contours are the RHESSI emissions at 12−25 keV, 25−50 keV, and 50−100 keV, respectively, integrated between 01:51:00 and 01:51:16 UT. The contour levels are similar to the ones in Fig. 3.
Current usage metrics show cumulative count of Article Views (full-text article views including HTML views, PDF and ePub downloads, according to the available data) and Abstracts Views on Vision4Press platform.
Data correspond to usage on the plateform after 2015. The current usage metrics is available 48-96 hours after online publication and is updated daily on week days.
Initial download of the metrics may take a while.