Fig. 3
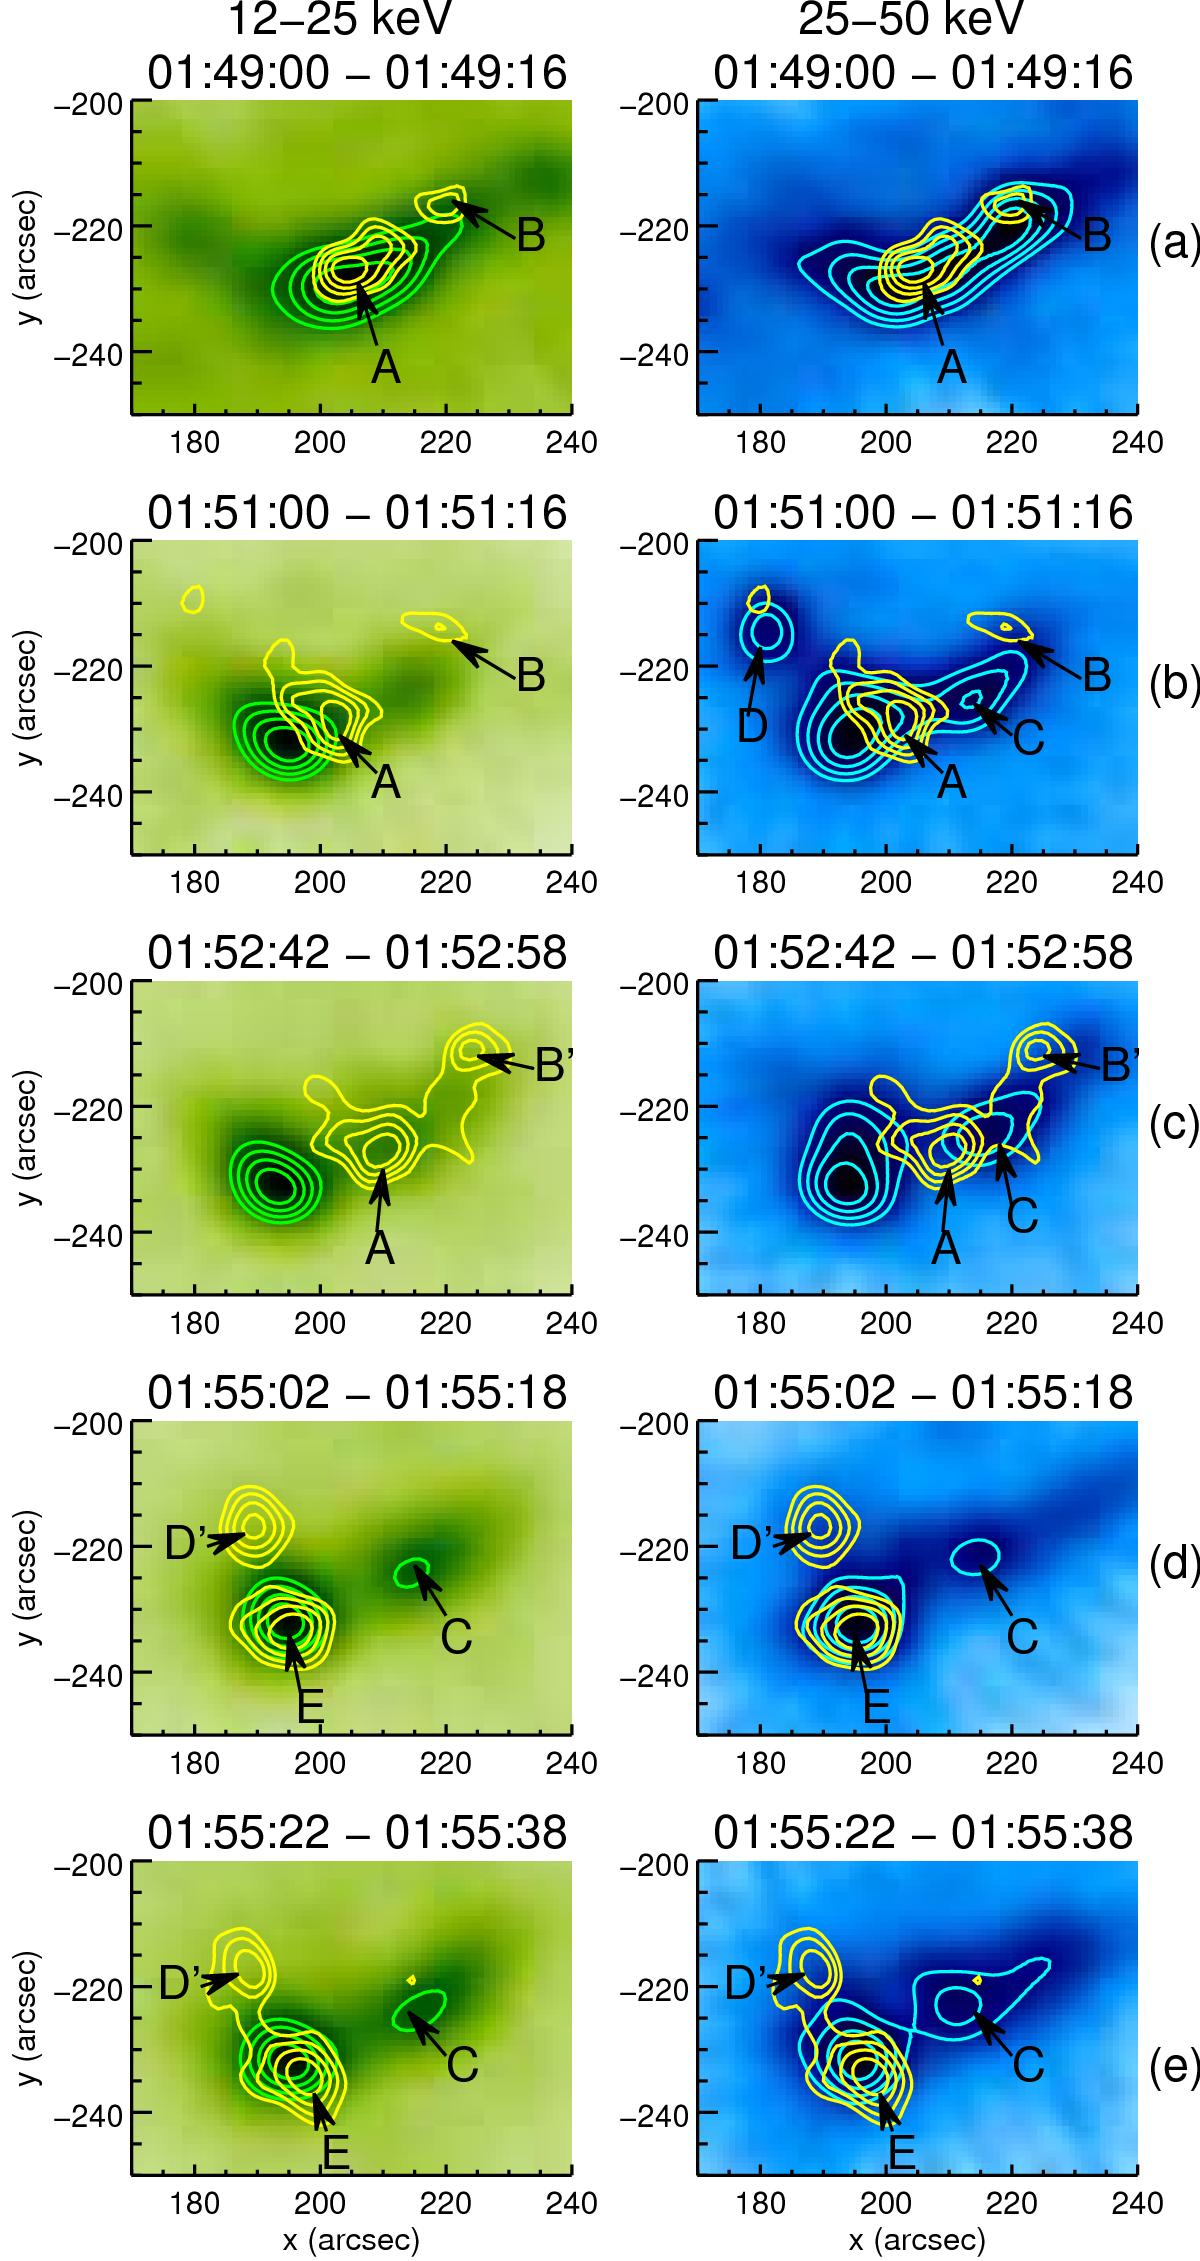
Left: RHESSI images at 12−25 keV (green), with contours at 12−25 keV (green) and 50−100 keV (yellow) overlaid on the images. Right: RHESSI images at 25−50 keV (blue), with contours at 25−50 keV (blue) and 50−100 keV (yellow) overlaid on the images. Images and contours are shown for five time intervals integrated over 16 s (from top to bottom: 01:49:00−01:49:16, 01:51:00−01:51:16, 01:52:42−01:52:58, 01:55:02−01:55:18, and 01:55:22−01:55:38 UT) corresponding to peaks in the 50−100 keV range. Images are obtained using detectors 2F, 3F, 4F, 5F, 6F, 7F, 8F, and 9F and the CLEAN algorithm. The green, blue, and yellow contours are 60%, 70%, 80%, and 90% of the image maximum value.
Current usage metrics show cumulative count of Article Views (full-text article views including HTML views, PDF and ePub downloads, according to the available data) and Abstracts Views on Vision4Press platform.
Data correspond to usage on the plateform after 2015. The current usage metrics is available 48-96 hours after online publication and is updated daily on week days.
Initial download of the metrics may take a while.