Fig. 2
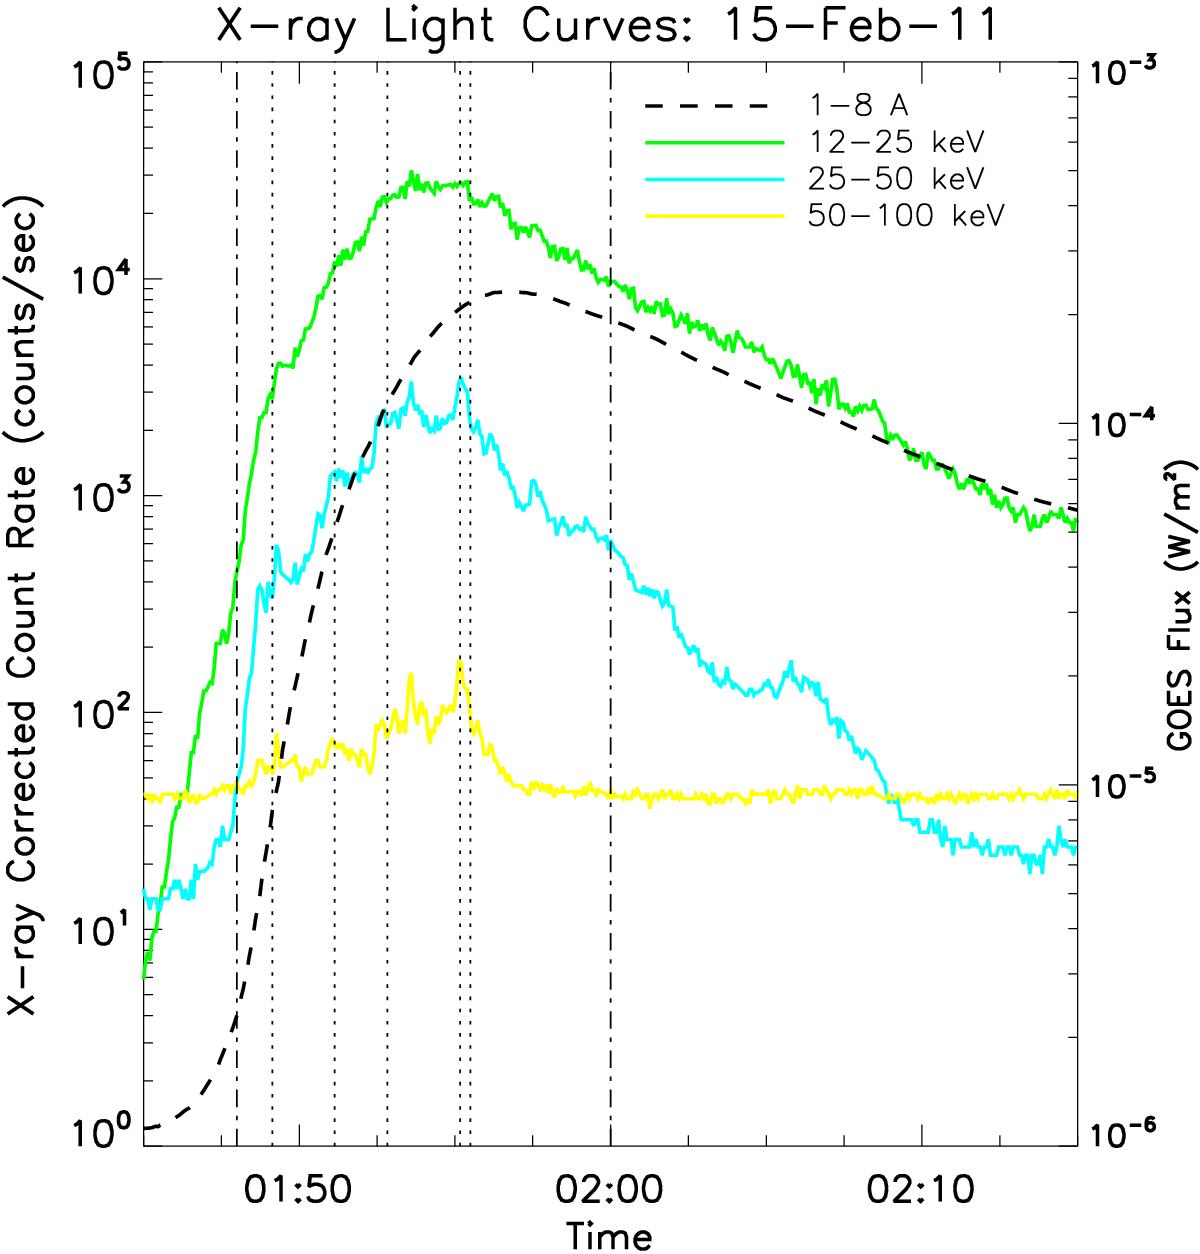
RHESSI corrected count rates between 01:45 and 02:15 UT, for different energy ranges (green: 12−25 keV; cyan: 25−50 keV; yellow: 50−100 keV) and GOES flux between 1.0 and 8.0 Å (dashed line). The vertical dash-dotted lines at 01:48 and 02:00 UT represent the time of the two magnetic maps used in the study, and the five vertical dotted lines represent the mean times when X-ray images are produced.
Current usage metrics show cumulative count of Article Views (full-text article views including HTML views, PDF and ePub downloads, according to the available data) and Abstracts Views on Vision4Press platform.
Data correspond to usage on the plateform after 2015. The current usage metrics is available 48-96 hours after online publication and is updated daily on week days.
Initial download of the metrics may take a while.