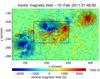
Fig. 1
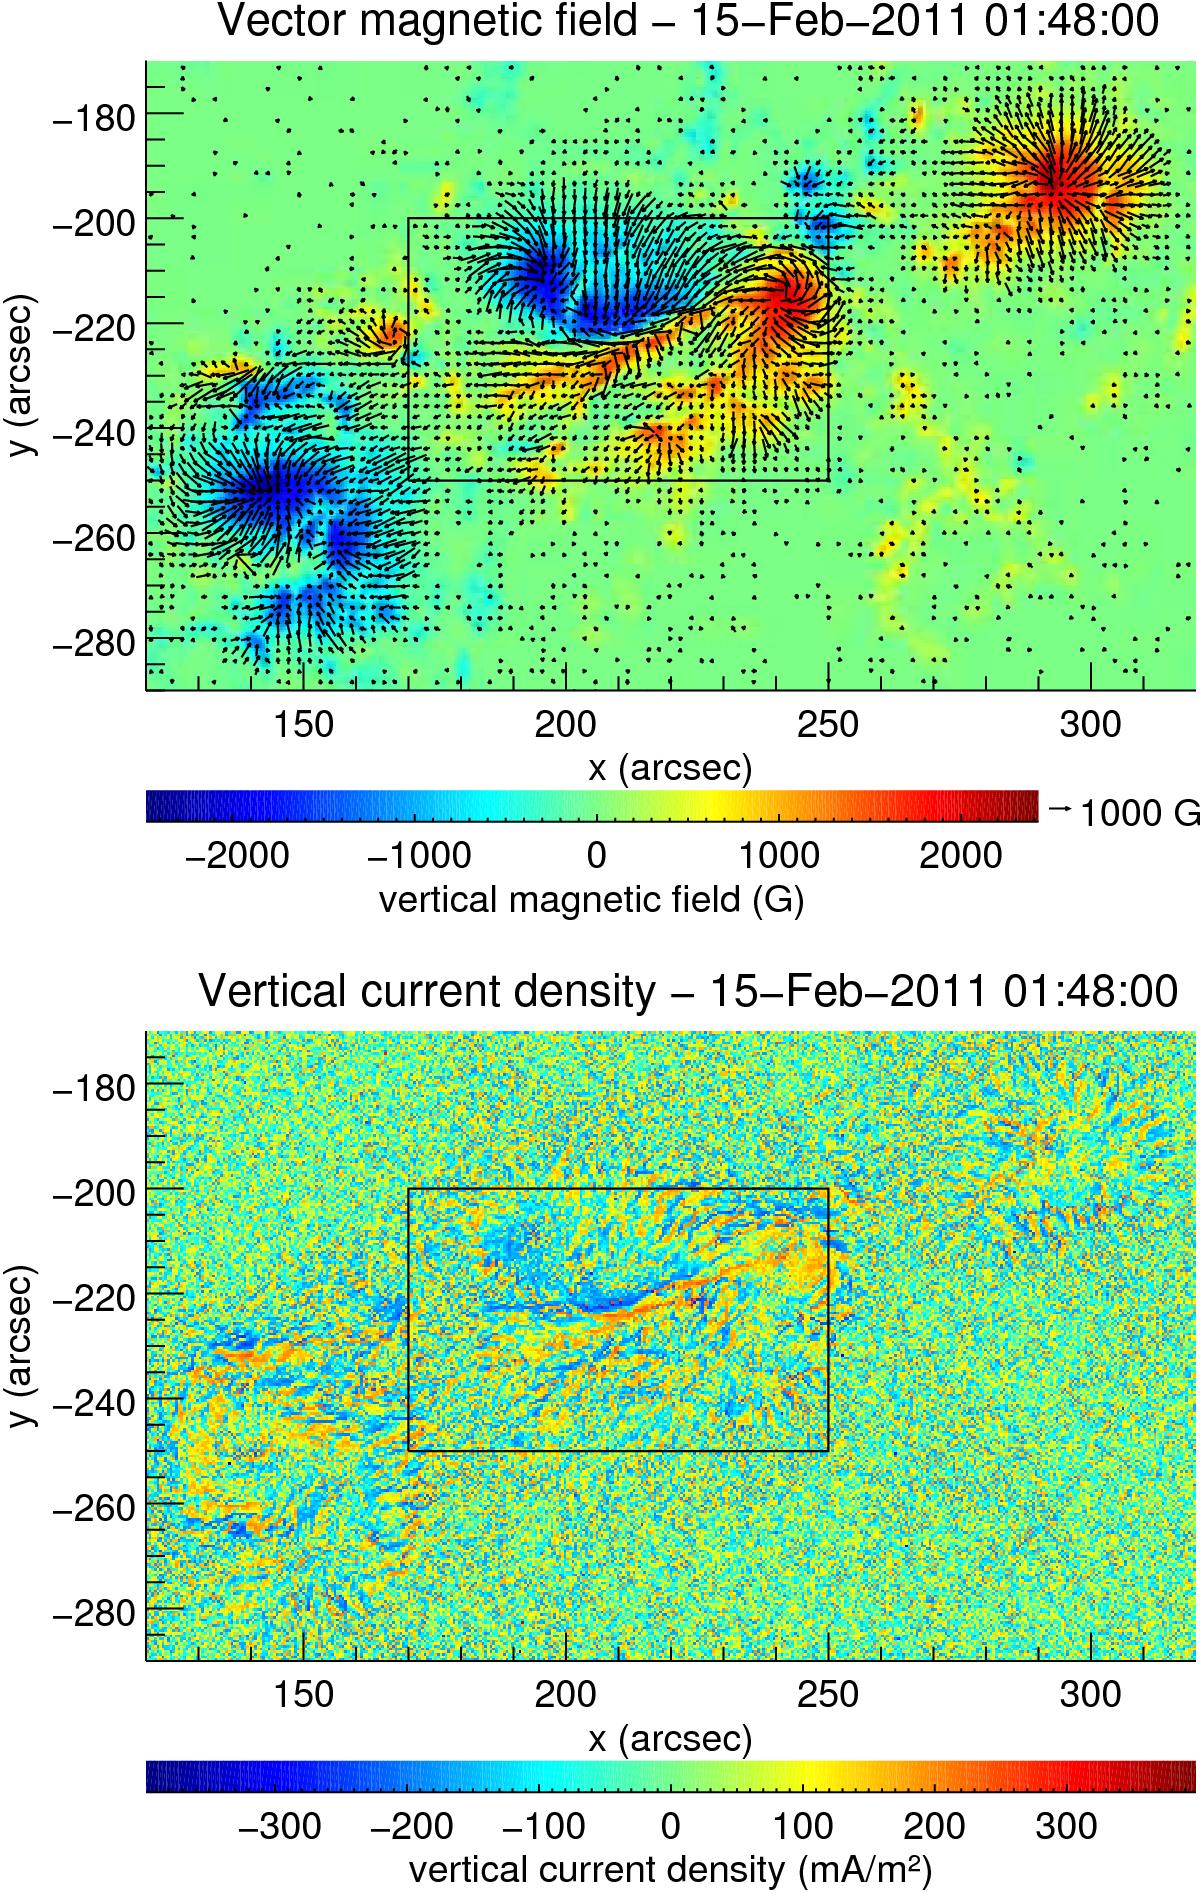
Top: vector magnetic field map, bottom: vertical electric current density map of the active region NOAA AR 11158; produced from HMI data, on February 15, 2011, at 01:48:00 UT, and represented in the plane-of-sky (see text and Appendix A for more details). The rectangular box represents the field of view used in the present study. Top: the arrows represent the horizontal component of the field (for horizontal component greater than 100 G), and the colours represent the intensity of the vertical magnetic field (see scale). Bottom: vertical component of the electric current density (see colour scale).
Current usage metrics show cumulative count of Article Views (full-text article views including HTML views, PDF and ePub downloads, according to the available data) and Abstracts Views on Vision4Press platform.
Data correspond to usage on the plateform after 2015. The current usage metrics is available 48-96 hours after online publication and is updated daily on week days.
Initial download of the metrics may take a while.