Fig. 1
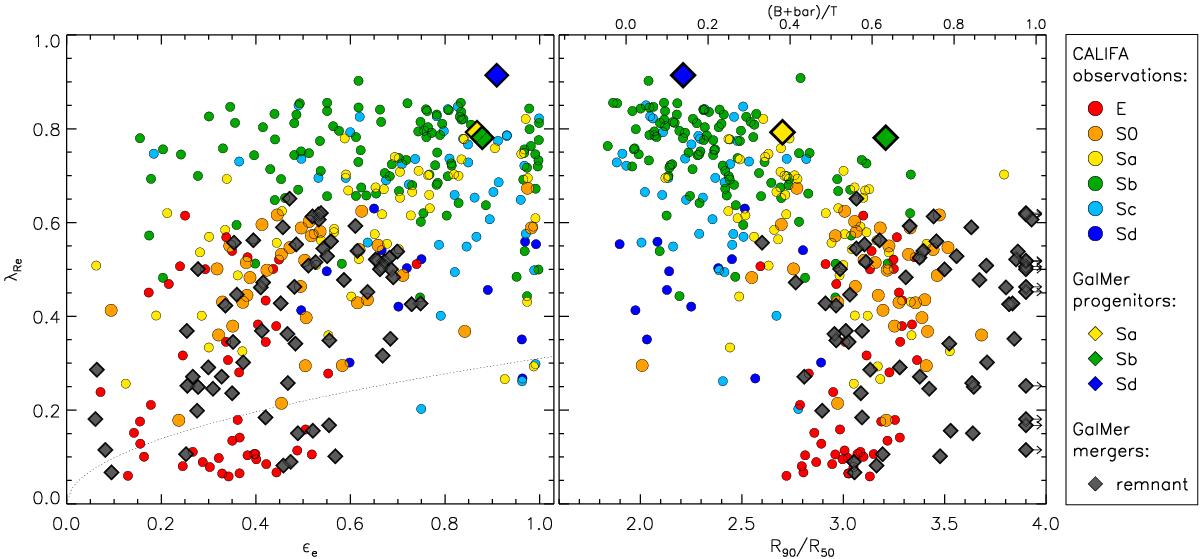
Stellar angular momentum (λRe) plotted against the ellipticity (εe, left) and concentration (R90/R50, right) for the GalMer simulations (original models and merger remnants), in comparison to CALIFA galaxies. All the parameters correspond to an edge-on view. The dotted line in the left plot represents the division between fast and slow rotators, and the top axis in the right plot is from Gadotti (2009), valid only up to (B + bar) /T < 0.6. See legend at the right for the symbols and colour-coding.
Current usage metrics show cumulative count of Article Views (full-text article views including HTML views, PDF and ePub downloads, according to the available data) and Abstracts Views on Vision4Press platform.
Data correspond to usage on the plateform after 2015. The current usage metrics is available 48-96 hours after online publication and is updated daily on week days.
Initial download of the metrics may take a while.