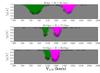
Fig. 1
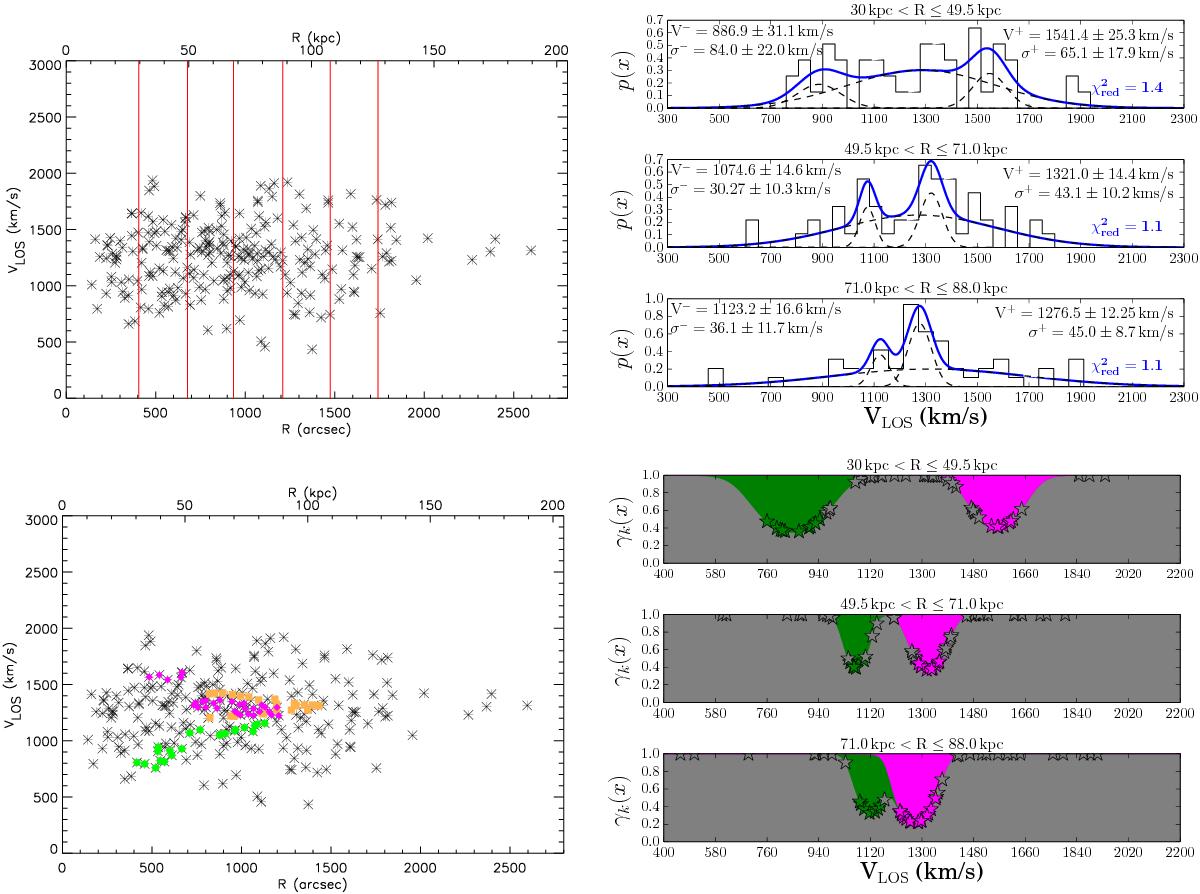
Top left: projected phase space, VLOS vs. major axis distance (R), for all spectroscopically confirmed PNs (black asterisks) in the halo of M 87. Red lines separate the elliptical annuli analysed to isolate cold components associated to the substructure. Top-right: histograms of the LOSVD in the three elliptical annuli. In each panel, the blue lines show the best-fit model computed as a combination of three Gaussians. Black dashed lines show the relative contribution of each component to the LOSVD, with parameters for the cold components given in the plot. Bottom left: as in the top left panel, however, the green circles and magenta diamonds show the PNs associated with the cold secondary peaks in the LOSVD. Orange squares show a kinematically selected GC substructure from Romanowsky et al. (2012). Bottom right: probability that a PN is drawn from the halo component (dark grey area) or from the chevron (green, magenta areas). Stars represent PN probabilities at their measured VLOS.
Current usage metrics show cumulative count of Article Views (full-text article views including HTML views, PDF and ePub downloads, according to the available data) and Abstracts Views on Vision4Press platform.
Data correspond to usage on the plateform after 2015. The current usage metrics is available 48-96 hours after online publication and is updated daily on week days.
Initial download of the metrics may take a while.