Free Access
Fig. 1
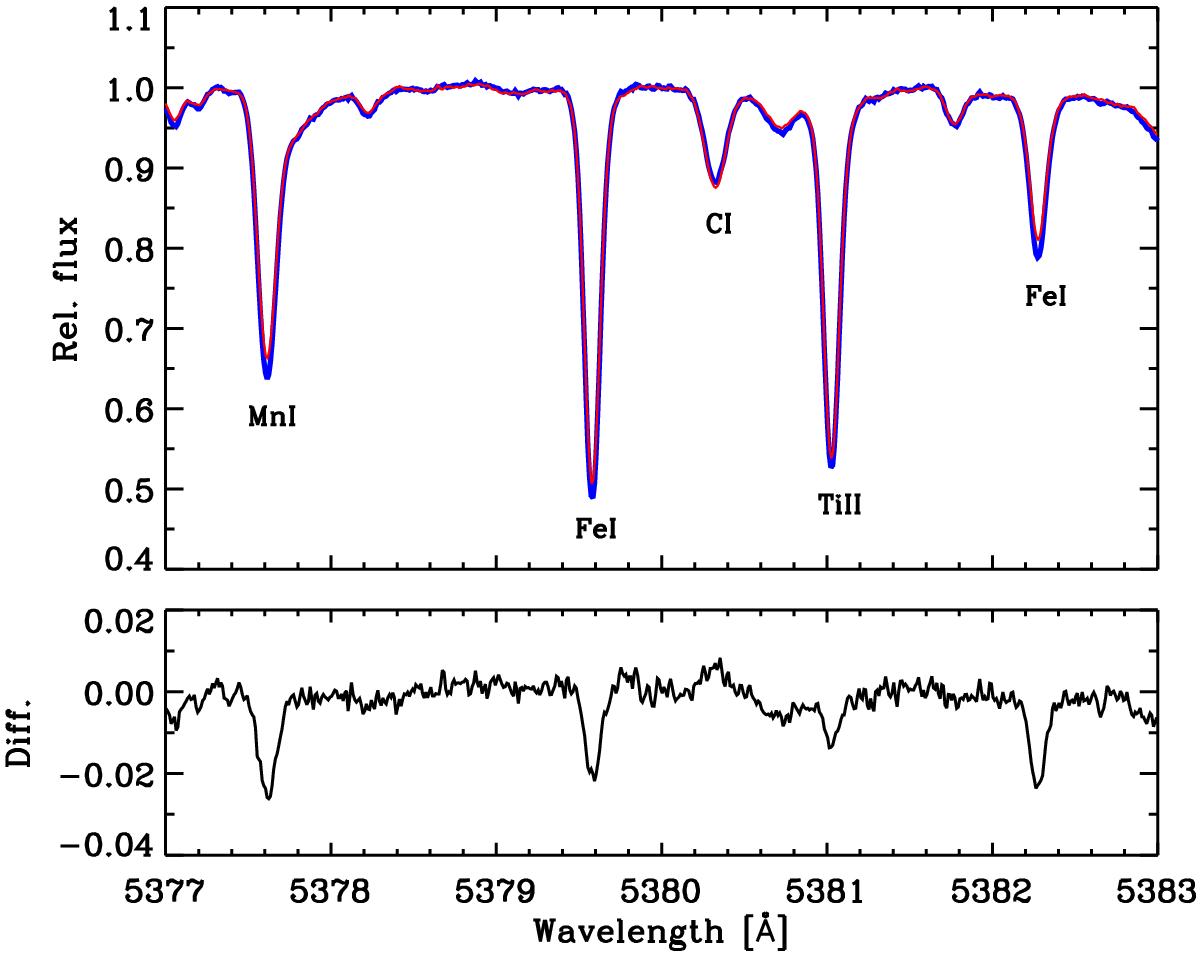
Solar flux HARPS spectrum around the C i line at 5380 Å obtained via reflected light from Vesta (thin, red line) in comparison with the HARPS spectrum of HD 27063 (thick, blue line). The lower panel shows the difference (HD 27063 – Sun) between the two spectra.
Current usage metrics show cumulative count of Article Views (full-text article views including HTML views, PDF and ePub downloads, according to the available data) and Abstracts Views on Vision4Press platform.
Data correspond to usage on the plateform after 2015. The current usage metrics is available 48-96 hours after online publication and is updated daily on week days.
Initial download of the metrics may take a while.