Fig. B.1
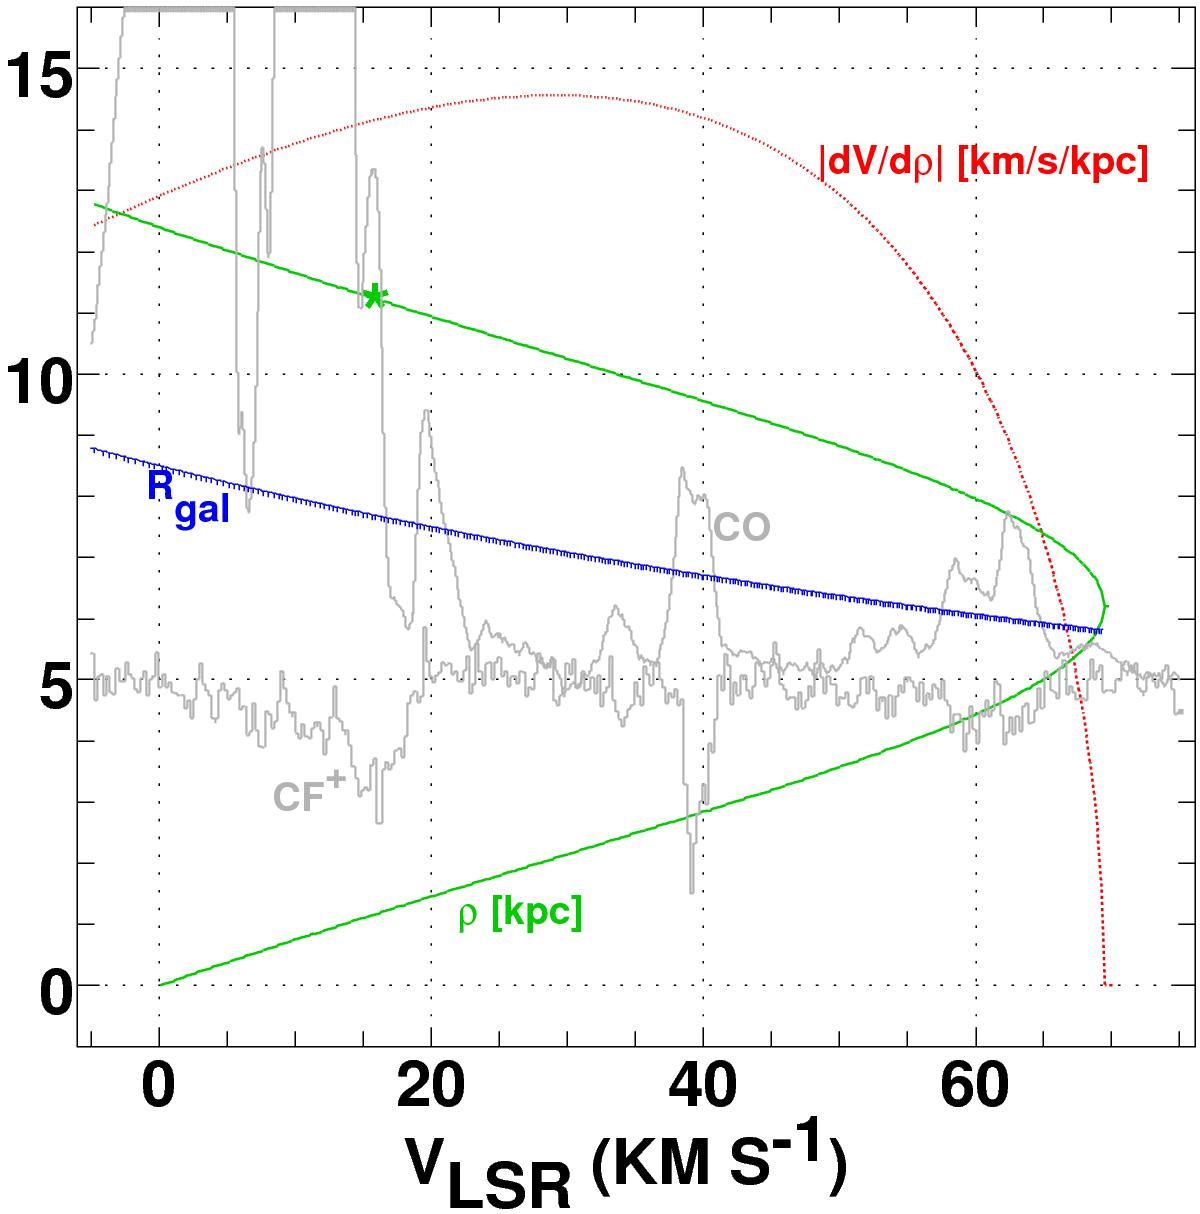
W49N line of sight kinematics in a nutshell. The mottled blue line shows the galactocentric radius R at each velocity assuming a flat rotation curve with Θ(R) = Θ(R0) = 220 km s-1, R0 = 8.5 kpc. The solid green curve shows the line of sight distance or distances ρ at each velocity and the distance to W49, ρ = 11.1 ± 0.8 kpc (Zhang et al. 2013) is illustrated by an an asterisk. The dotted red curve shows the line of sight velocity gradient dV/dρ due to Galactic rotation. Shown superposed to illustrate the observed range of spectral features are the CO profile in units of Kelvins, offset but not scaled, and the CF+ absorption spectrum scaled upward a factor of 100 and offset, both from Fig. 1.
Current usage metrics show cumulative count of Article Views (full-text article views including HTML views, PDF and ePub downloads, according to the available data) and Abstracts Views on Vision4Press platform.
Data correspond to usage on the plateform after 2015. The current usage metrics is available 48-96 hours after online publication and is updated daily on week days.
Initial download of the metrics may take a while.