Fig. A.1
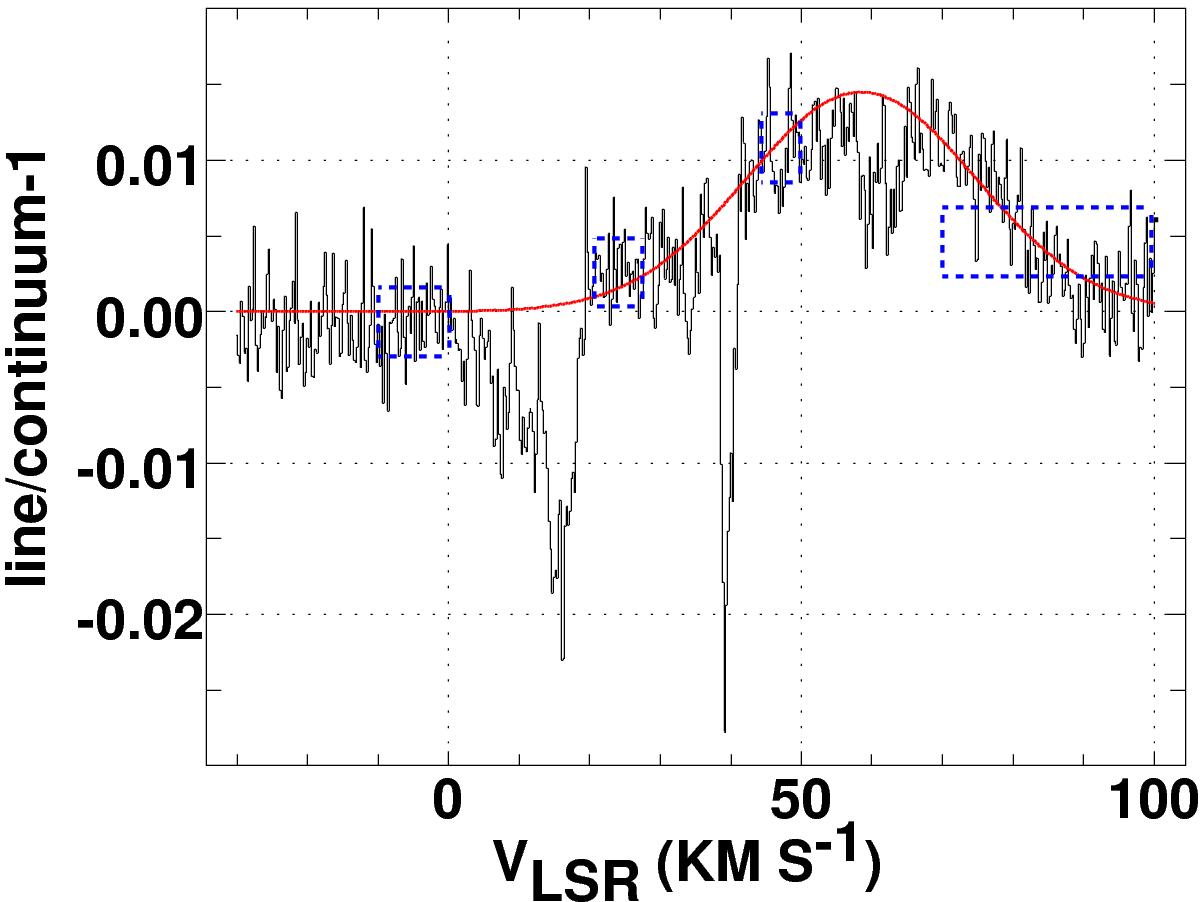
CF+ and recombination line profiles observed toward W49N. The solid black histogram is the continuum-subtracted profile using a linear spectral baseline fit to signal-free channels well outside the region shown. The red line shows the Gaussian profile fitted to the recombination line emission over the spectrum segments outlined in blue, which were chosen to coincide with regions of small HF, hence CF+ absorption.
Current usage metrics show cumulative count of Article Views (full-text article views including HTML views, PDF and ePub downloads, according to the available data) and Abstracts Views on Vision4Press platform.
Data correspond to usage on the plateform after 2015. The current usage metrics is available 48-96 hours after online publication and is updated daily on week days.
Initial download of the metrics may take a while.