Fig. 5
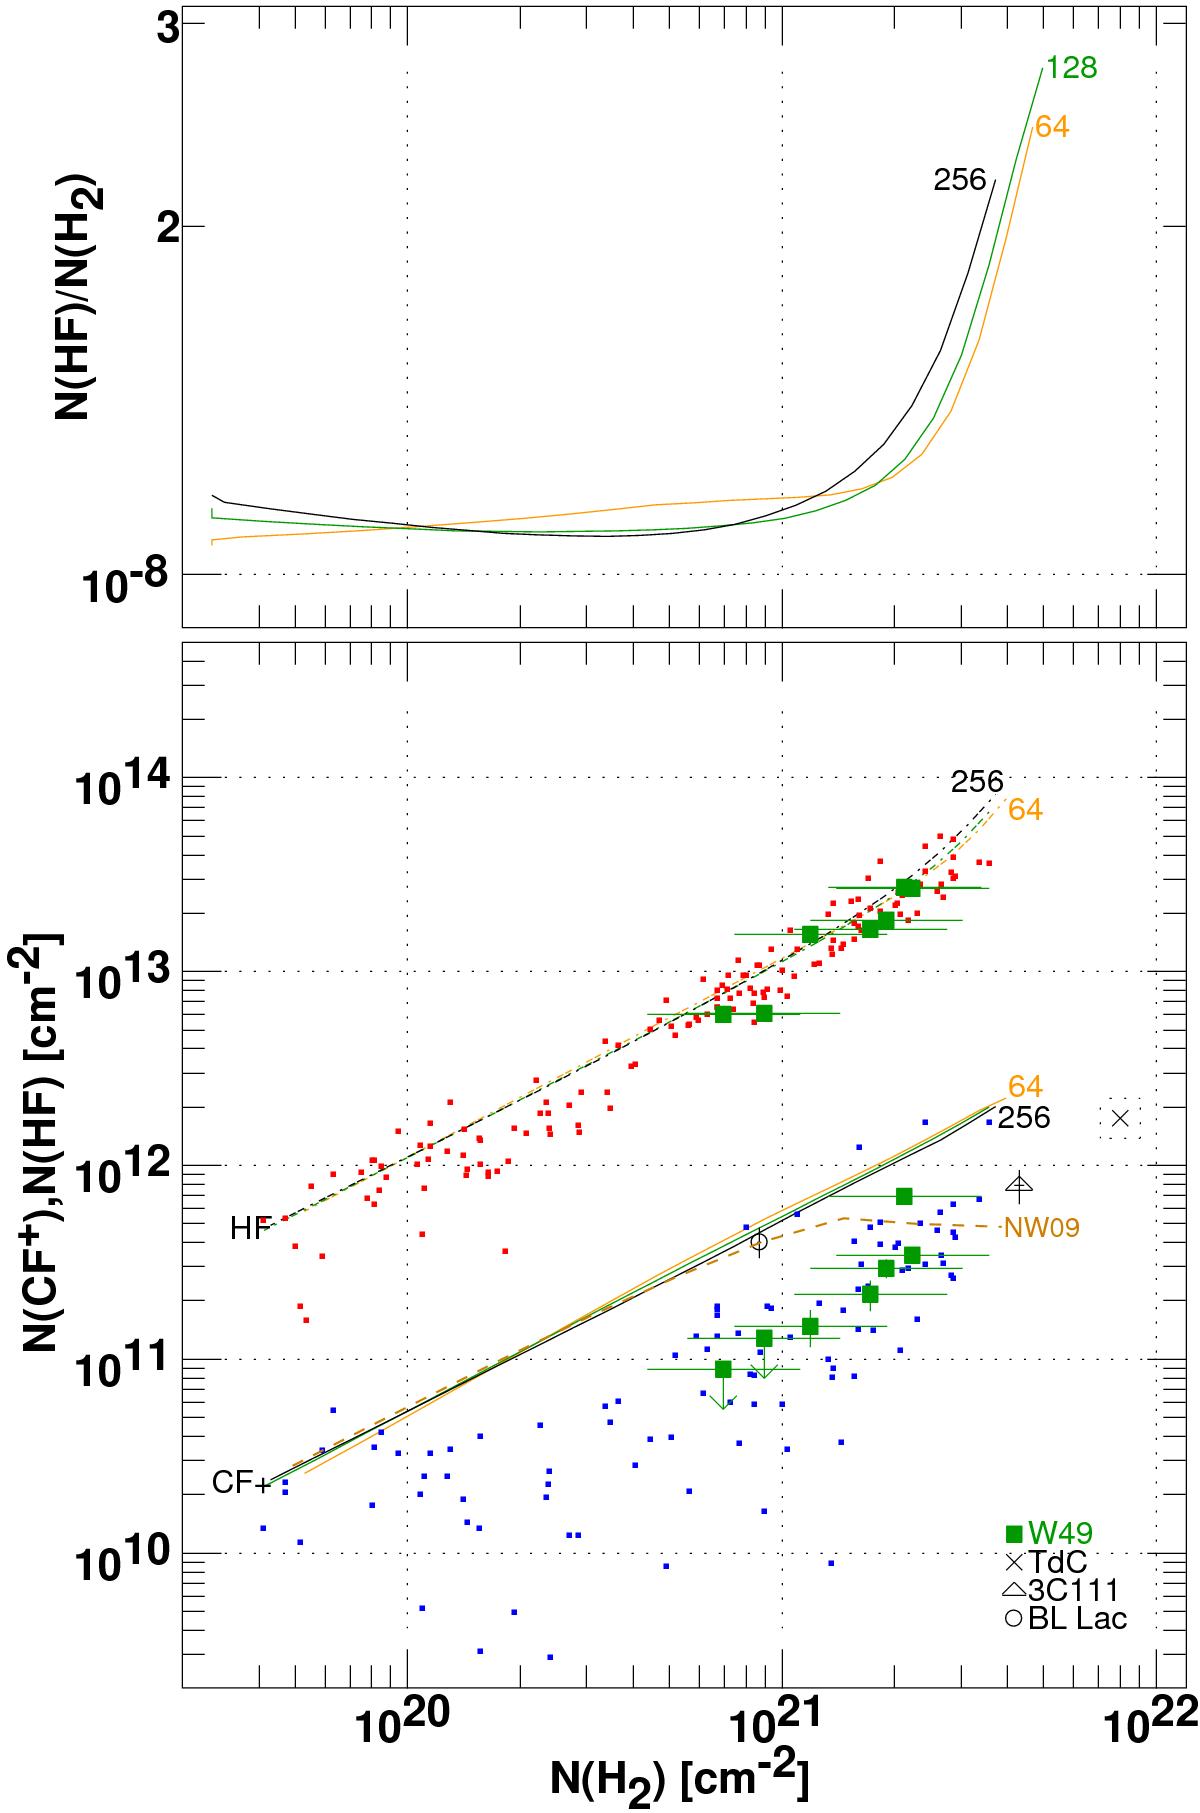
Model and observed CF+ and HF abundances. Upper: the HF/H2 ratio in models of HF and H2 formation at total densities n(H) = 64, 128 and 256 cm-3. Lower: observed and model HF and CF+ column densities. The W49N data were placed in the plane using N(CH)/N(H2) = 3.5 × 10⁻⁸ and the data for BL Lac and 3C 111 were positioned relative to HCO+ assuming N(HCO+)/N(H2) = 3 × 10⁻⁹. Profile sums over the velocity intervals in Table 2 are shown as solid symbols and upper limits are 3σ. Individual channel values of the HF and CF+ optical depth spectra are shown as red and blue points, respectively, after scaling in each coordinate by the Galactic line of sight velocity gradient for a flat rotation curve (see text). The dashed light brown curve shows the results of Neufeld & Wolfire (2009).
Current usage metrics show cumulative count of Article Views (full-text article views including HTML views, PDF and ePub downloads, according to the available data) and Abstracts Views on Vision4Press platform.
Data correspond to usage on the plateform after 2015. The current usage metrics is available 48-96 hours after online publication and is updated daily on week days.
Initial download of the metrics may take a while.